Electronic Credit Trading Defies Volatility, Stays Surprisingly Sticky

Izzy Conlin
Head of Strategy & Solutions for Global Markets at Tradeweb
To the long list of stressful milestones in the lives of fixed income market participants, we can now add March of 2023 alongside March of 2008 and October of 1987 as the true tests of our intestinal fortitude.
On Friday March 10, 2023, Silicon Valley Bank (SIVB) closed by federal regulators. After costly liquidation of investments to cover a surge in withdrawals, the 16th largest bank in the U.S. faced a liquidity crisis. By March 17, Silicon Valley Bank’s parent company – SVB Financial – had filed for bankruptcy and fears of a global banking crisis quickly became widespread. At the same time, another crisis was looming. On March 14, Credit Suisse’s (CS) stock dropped 25%. After years of losses, combined with broader panic in the financial sector, clients began rapidly withdrawing their money. Five days later, after the Swiss government intervened in negotiations, rival bank UBS agreed to acquire Credit Suisse for $3.25 billion – a significant discount –marking the end of the 167-year-old institution. $17bn worth of CS AT1 (Additional Tier One) bonds were written to zero, sending contagion to the roughly $250bn worth of AT1 bonds outstanding, primarily from European Banks.
These banking collapses were the largest financial crisis since 2008 and caused widespread uncertainty across fixed income markets. Despite bid/offer spreads widening in credit markets, we have reasons to be optimistic about how functional this period of volatility was relative to previous periods.
Thanks to technology investments made across both the buy-side and dealer communities, and electronic trading venues, specifically around trading infrastructure and systematic algorithmic pricing, the underlying infrastructure of electronic credit markets held strong throughout the period of increased volatility. We could not have said this 3 years ago.
Based on this performance under a period of extreme stress, it is clear that the “stickiness” of electronic trading in credit is here to stay.
March Madness and Elevated Trading in the Financial Sector
Let’s take a closer look at how credit markets responded during the crisis. Overall credit trading volume in March was slightly muted relative to previous months, which is expected during times of illiquidity. However, trading volumes did shift to the banking/financial sector.
TRACE volumes for CS & SIVB skyrocketed, capturing almost 4% of total TRACE for the month – up around 7x from February 2023. For the period of crisis (Mar 10 – Mar 20), CS & SIVB made up 10% of TRACE volume. We even saw spikes in trading over the weekend, with SIVB making up 85% of TRACE on Sunday, March 12 and CS making up over 90% of TRACE the following weekend. These increases highlight the urgency of the news surrounding these two companies and the willingness for clients to trade these names as quickly as possible.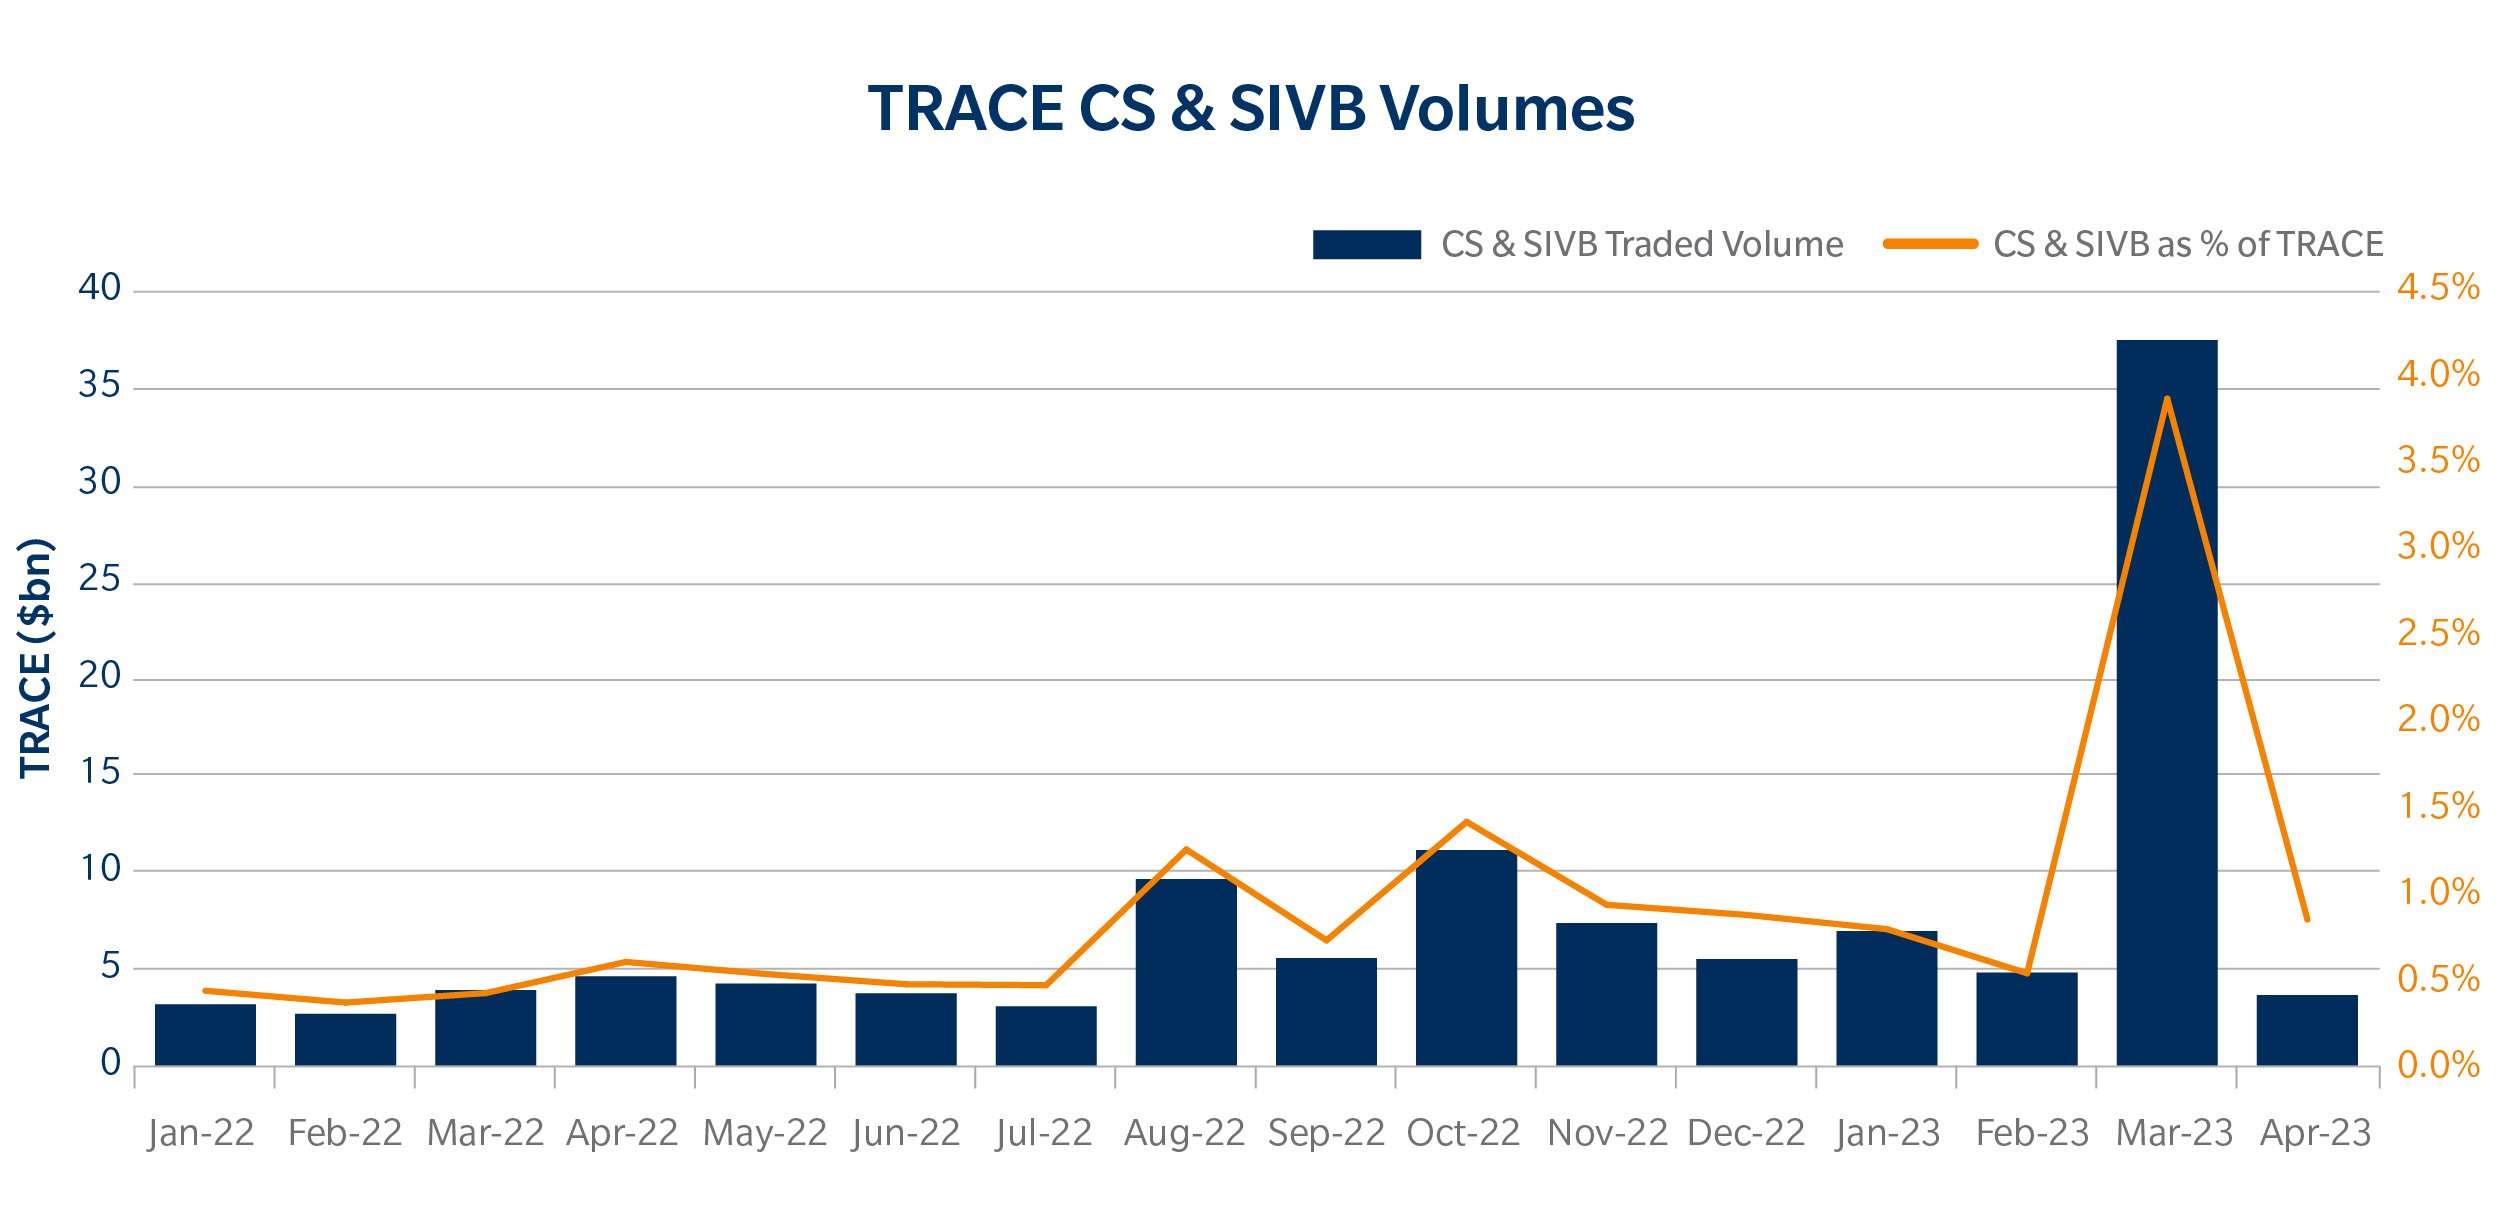
There were also instances of other regional bank bonds trading with higher volumes. For example, First Republic, Keybanc and Truist Financial bonds saw elevated trading volumes around this crisis period, potentially showing signs of possible contagion across the broader sector. This drove volumes for the financial sector to their highest percentage of TRACE since the beginning of 2022, breaking 23% of all TRACE volume.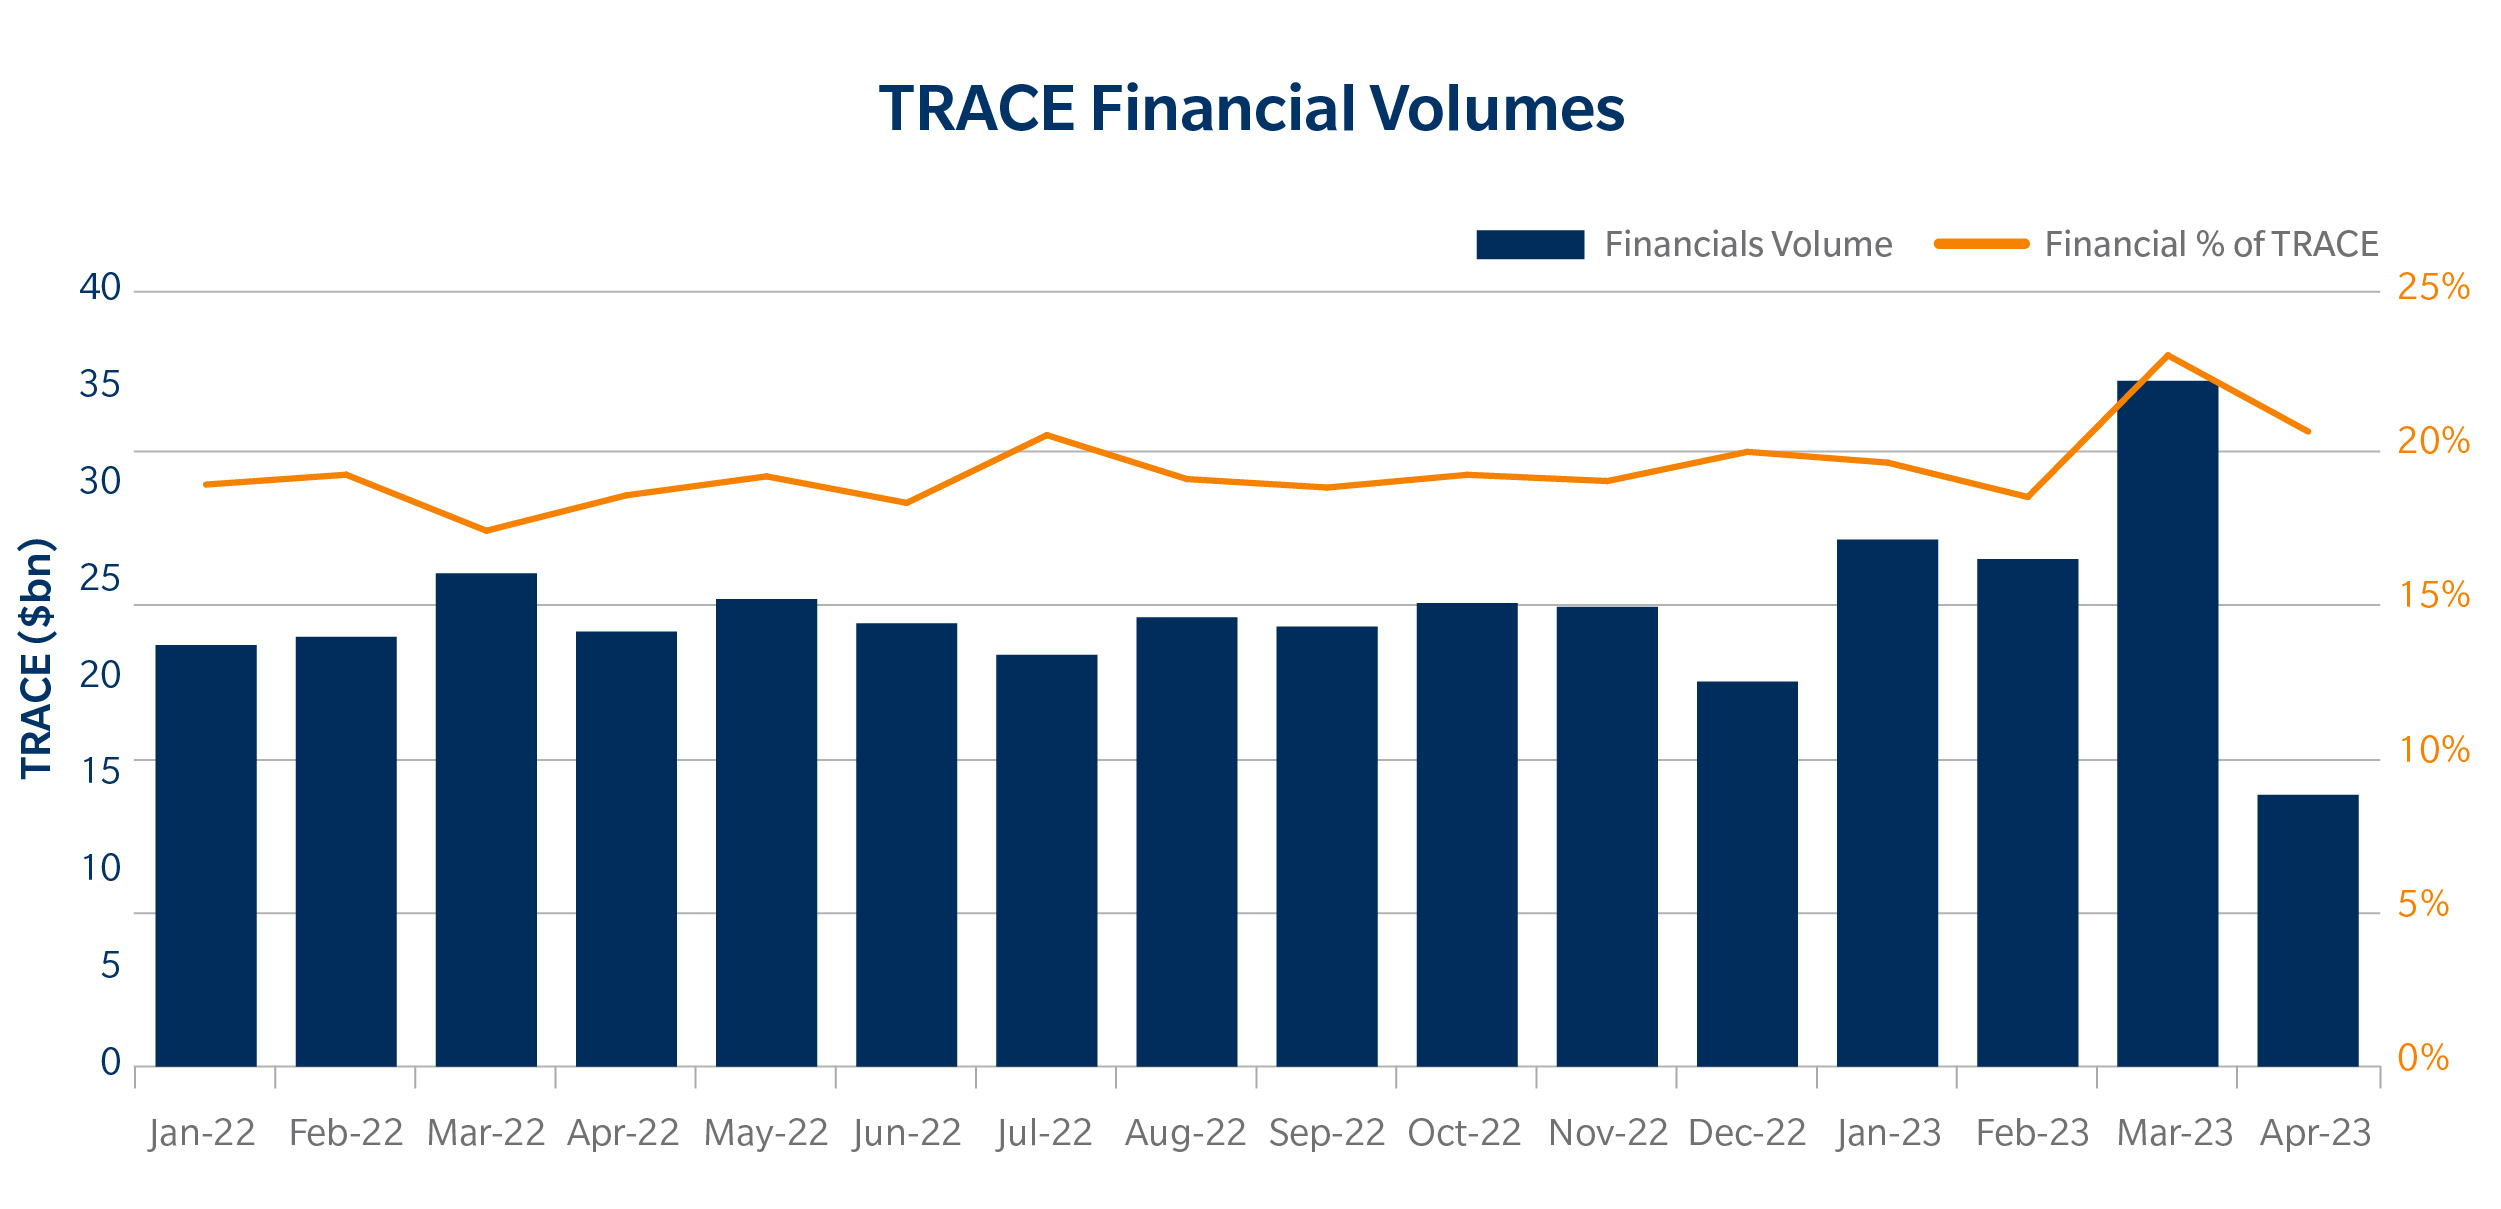
Surprisingly, in March, we did not see a huge change in the percentage of TRACE volumes made up from block trades (defined as 5MM+ for IG and 1MM+ for HY) hovering around 55% – similar to the average of the past year.
However, these block trades in March were made up primarily of large trades in financial sector. Typically, financial block trades represent about 15% of all block trades in the market, but in March, they were nearly 21%. This was driven by the two names – CS and SIVB – which encompassed approximately 20% of the financial block trades, an increase of nearly 5x the 12-month trailing average.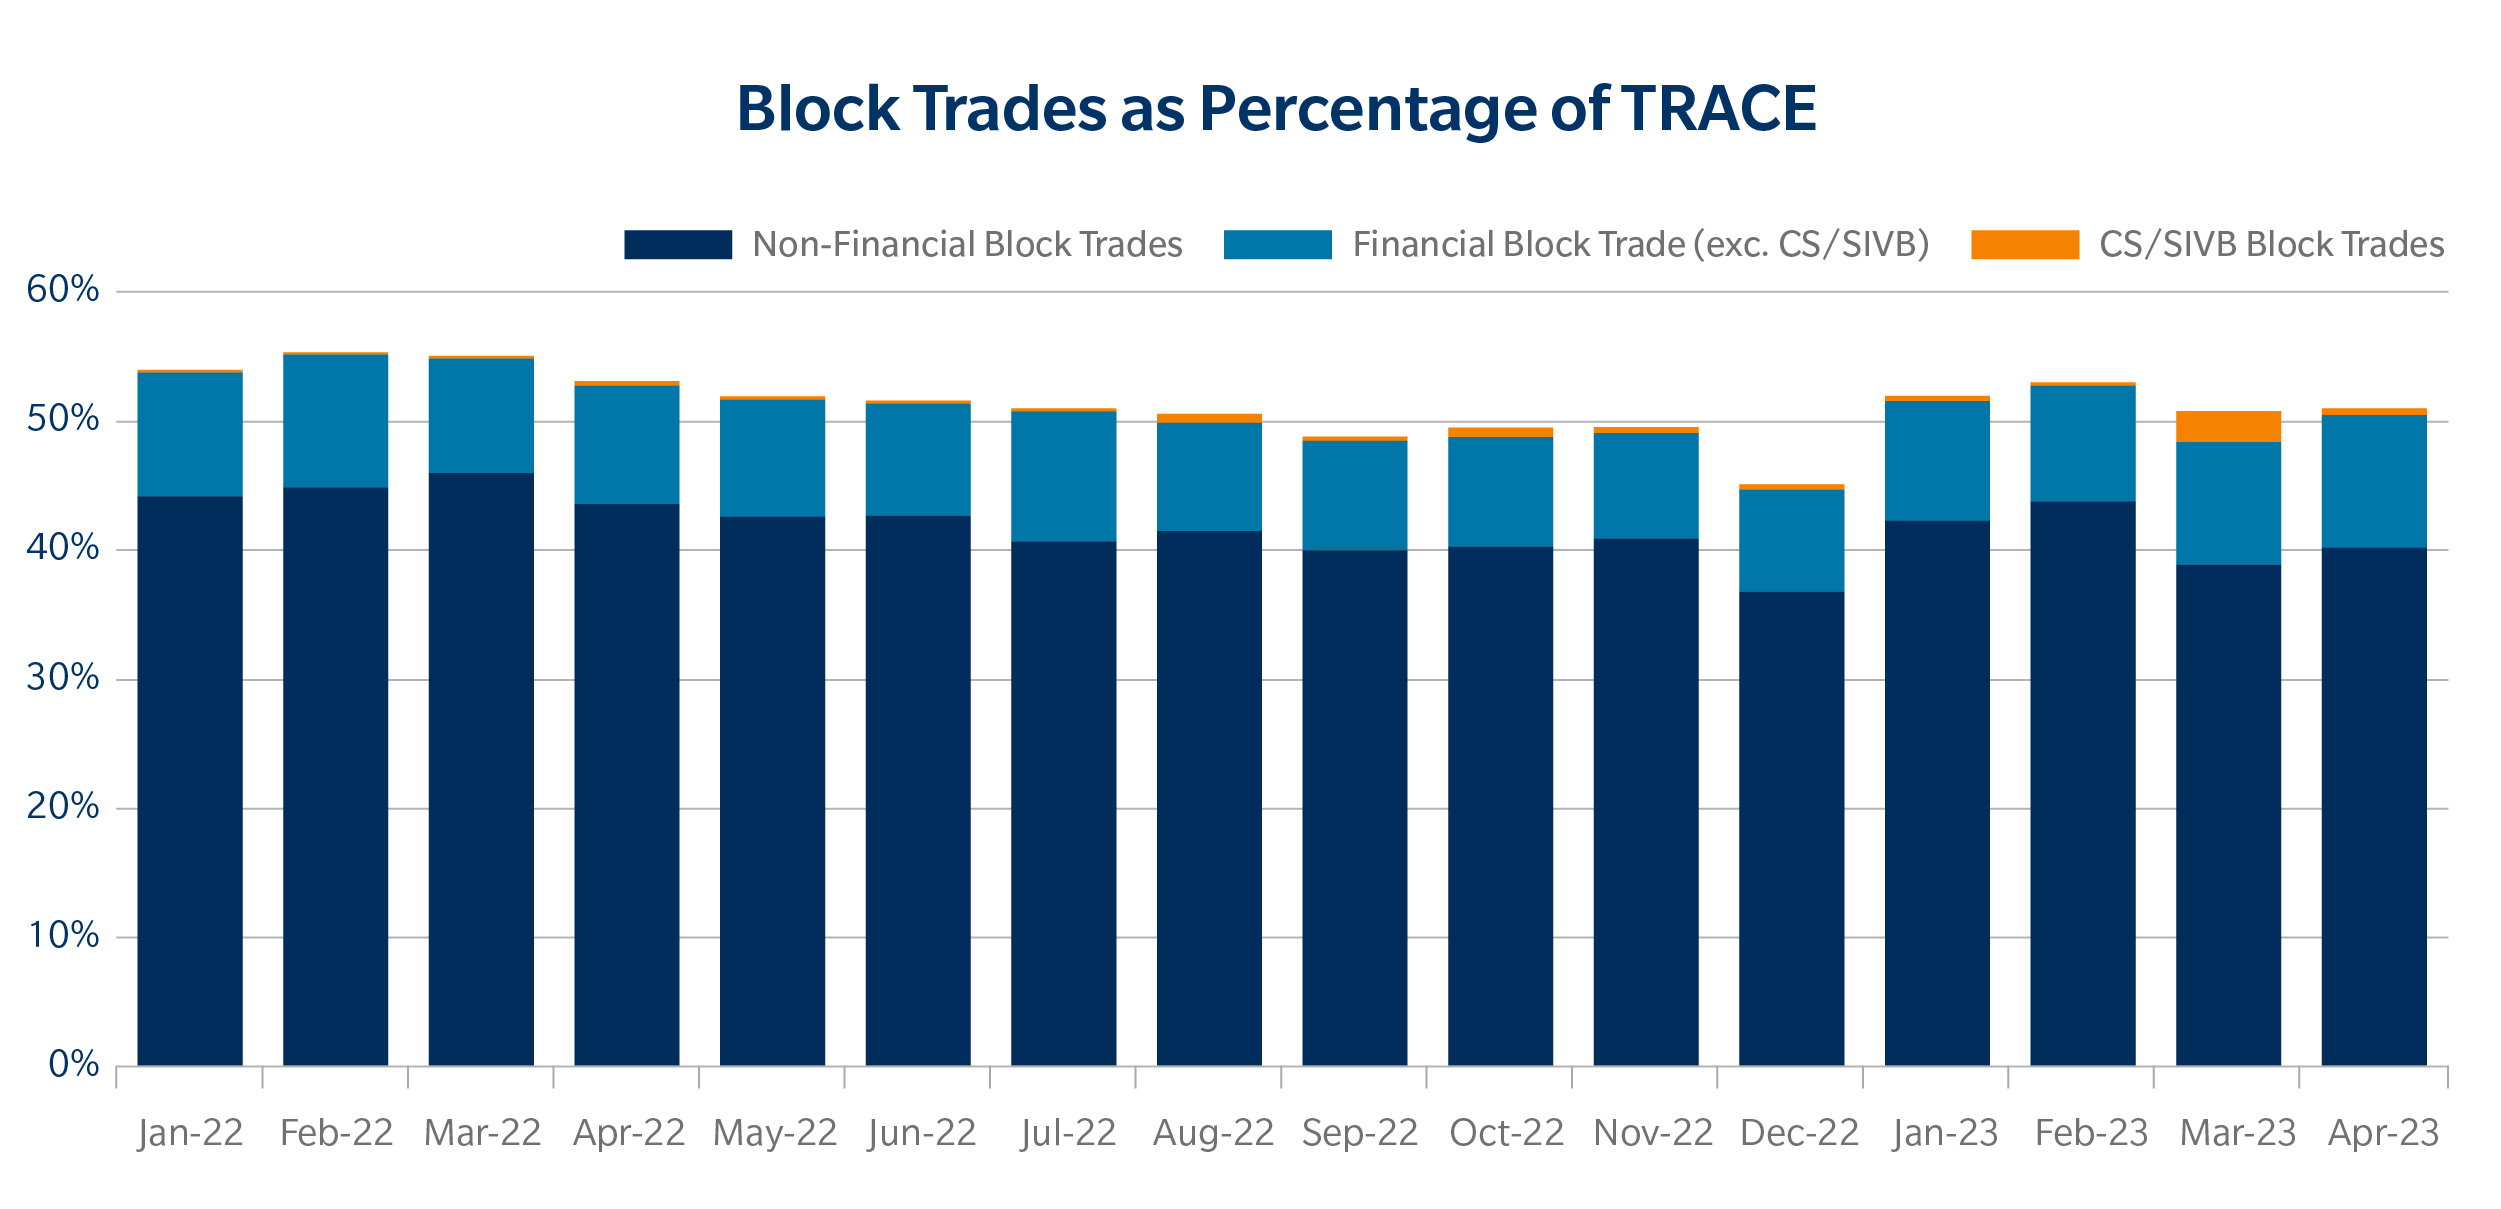
Electronic Trading in Credit Stayed Relatively Resilient
Historically during periods of extreme idiosyncratic volatility, traders have tended to switch away from electronic trading and start trading more over the phone.
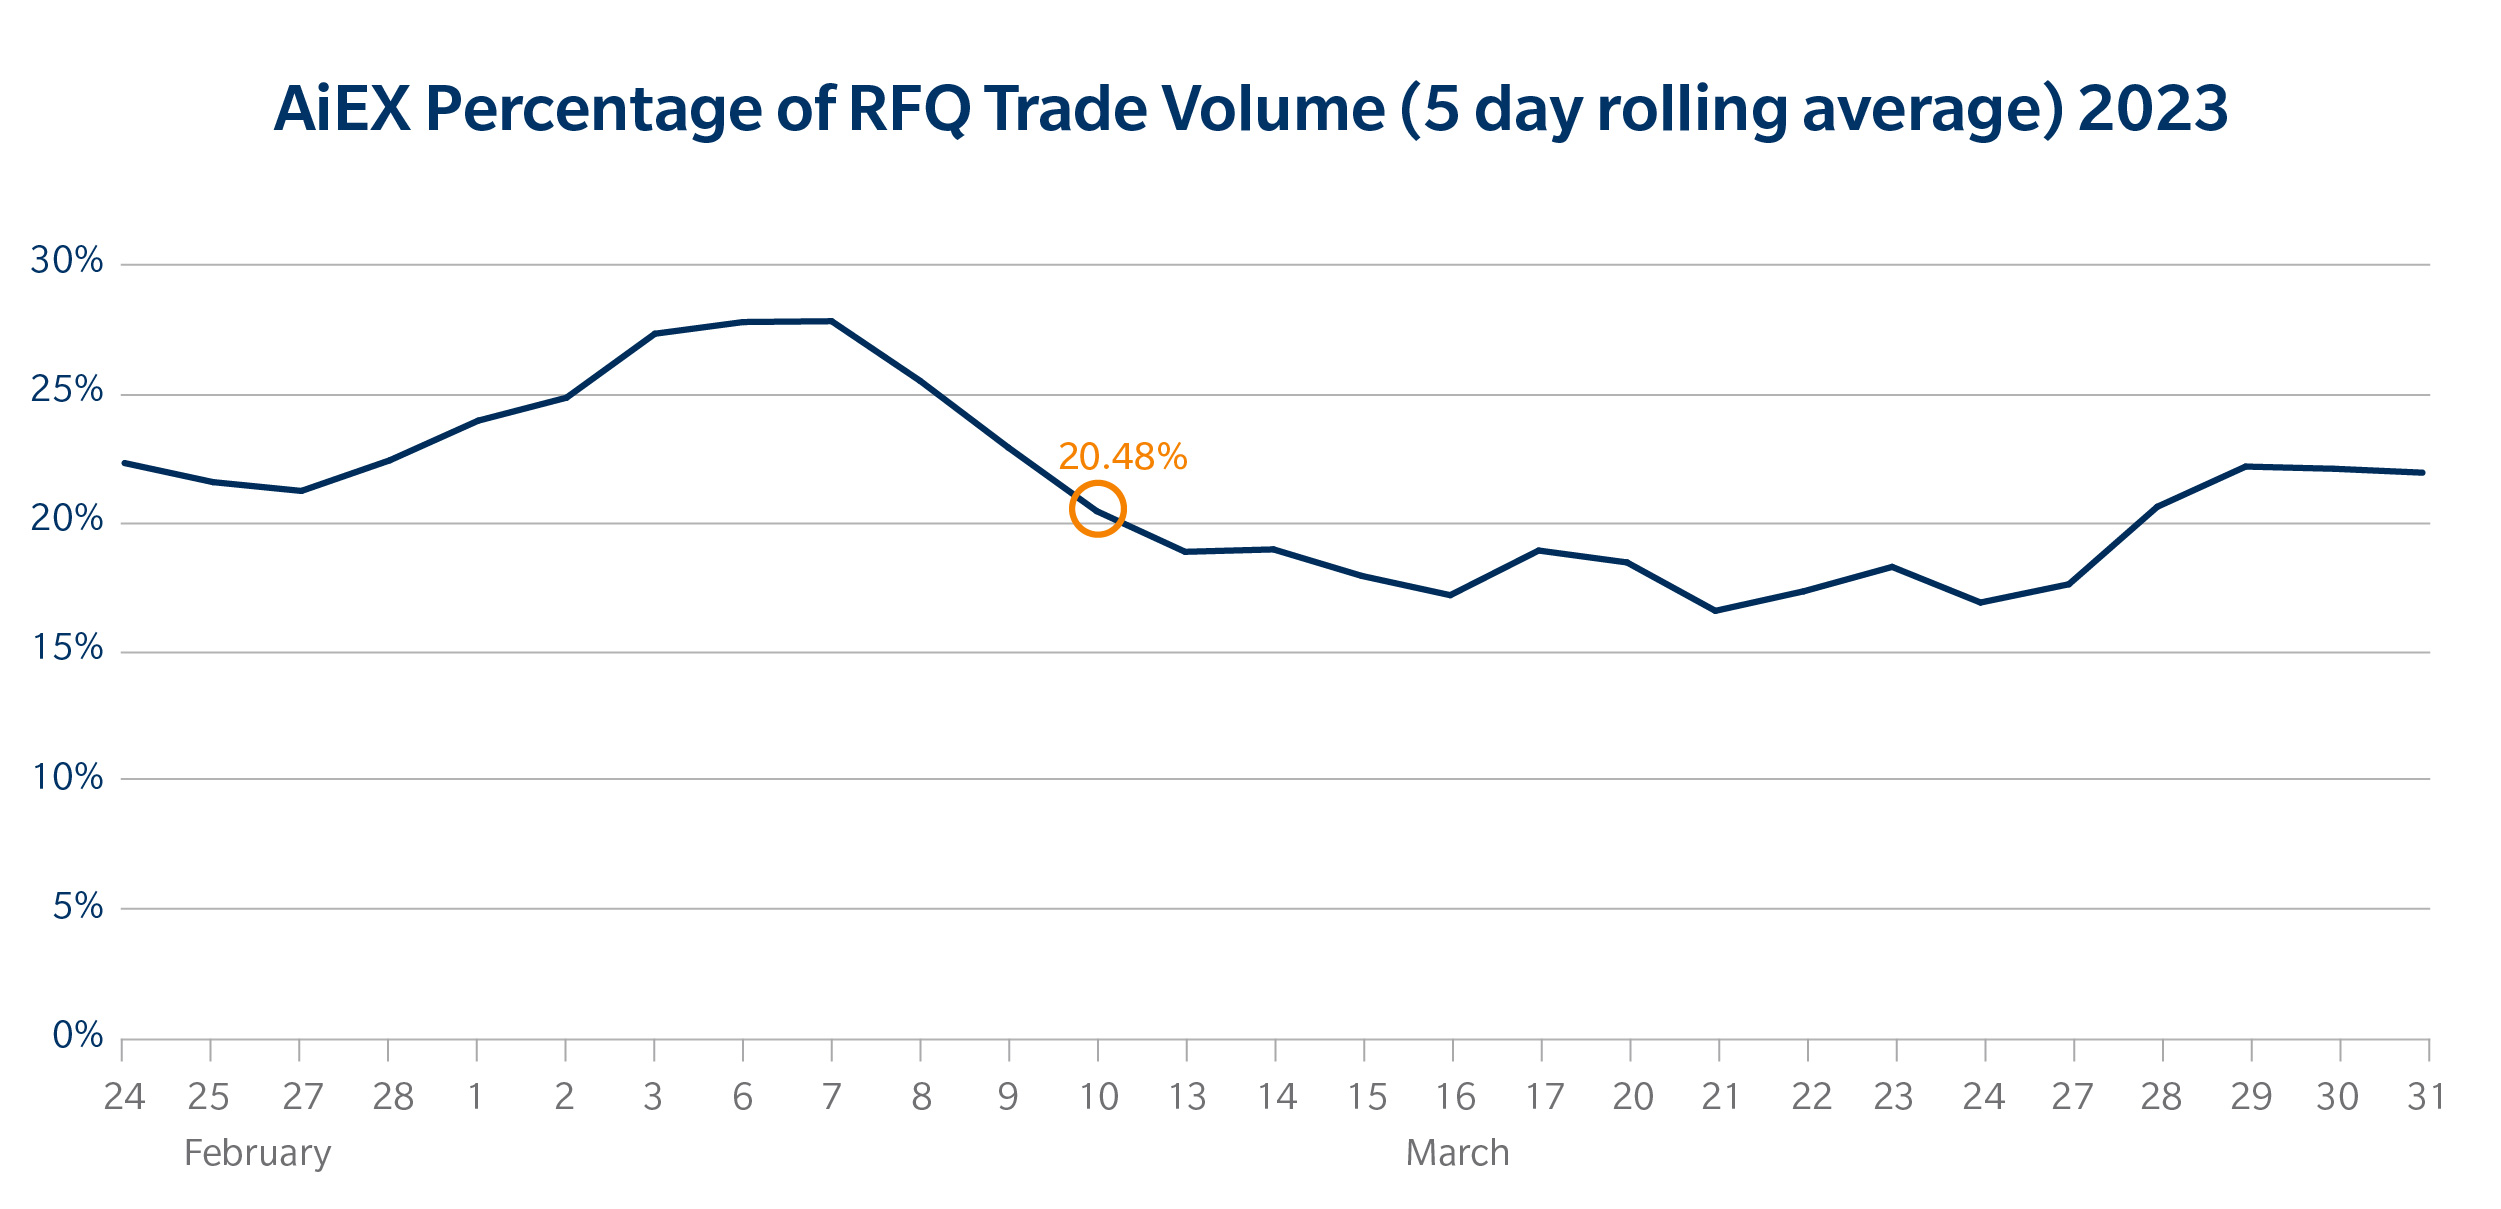
Although we did see a temporary shift in electronic protocols to voice trading, that quickly normalized within a week. Protocols including Portfolio Trading, request-for-quote (RFQ) and our Dealerweb Sweep Sessions were resilient, and by the end of the month, our volume ratio between electronic and voice protocols was back to average. Since electronic volumes on our institutional platform picked up towards month-end, overall voice trade processing for the entire month of March ended below average. Additionally, we saw steady use of our Automated Intelligent Execution (AiEX) technology which allows clients to use pre-programmed rules to determine execution of trades, throughout the period of volatility. In March 2020, for example, AiEX trading as percentage of total RFQ volume declined to almost 0.3%. By contrast, in in March 2023 we only saw a slight decline from 27% to 20.5%.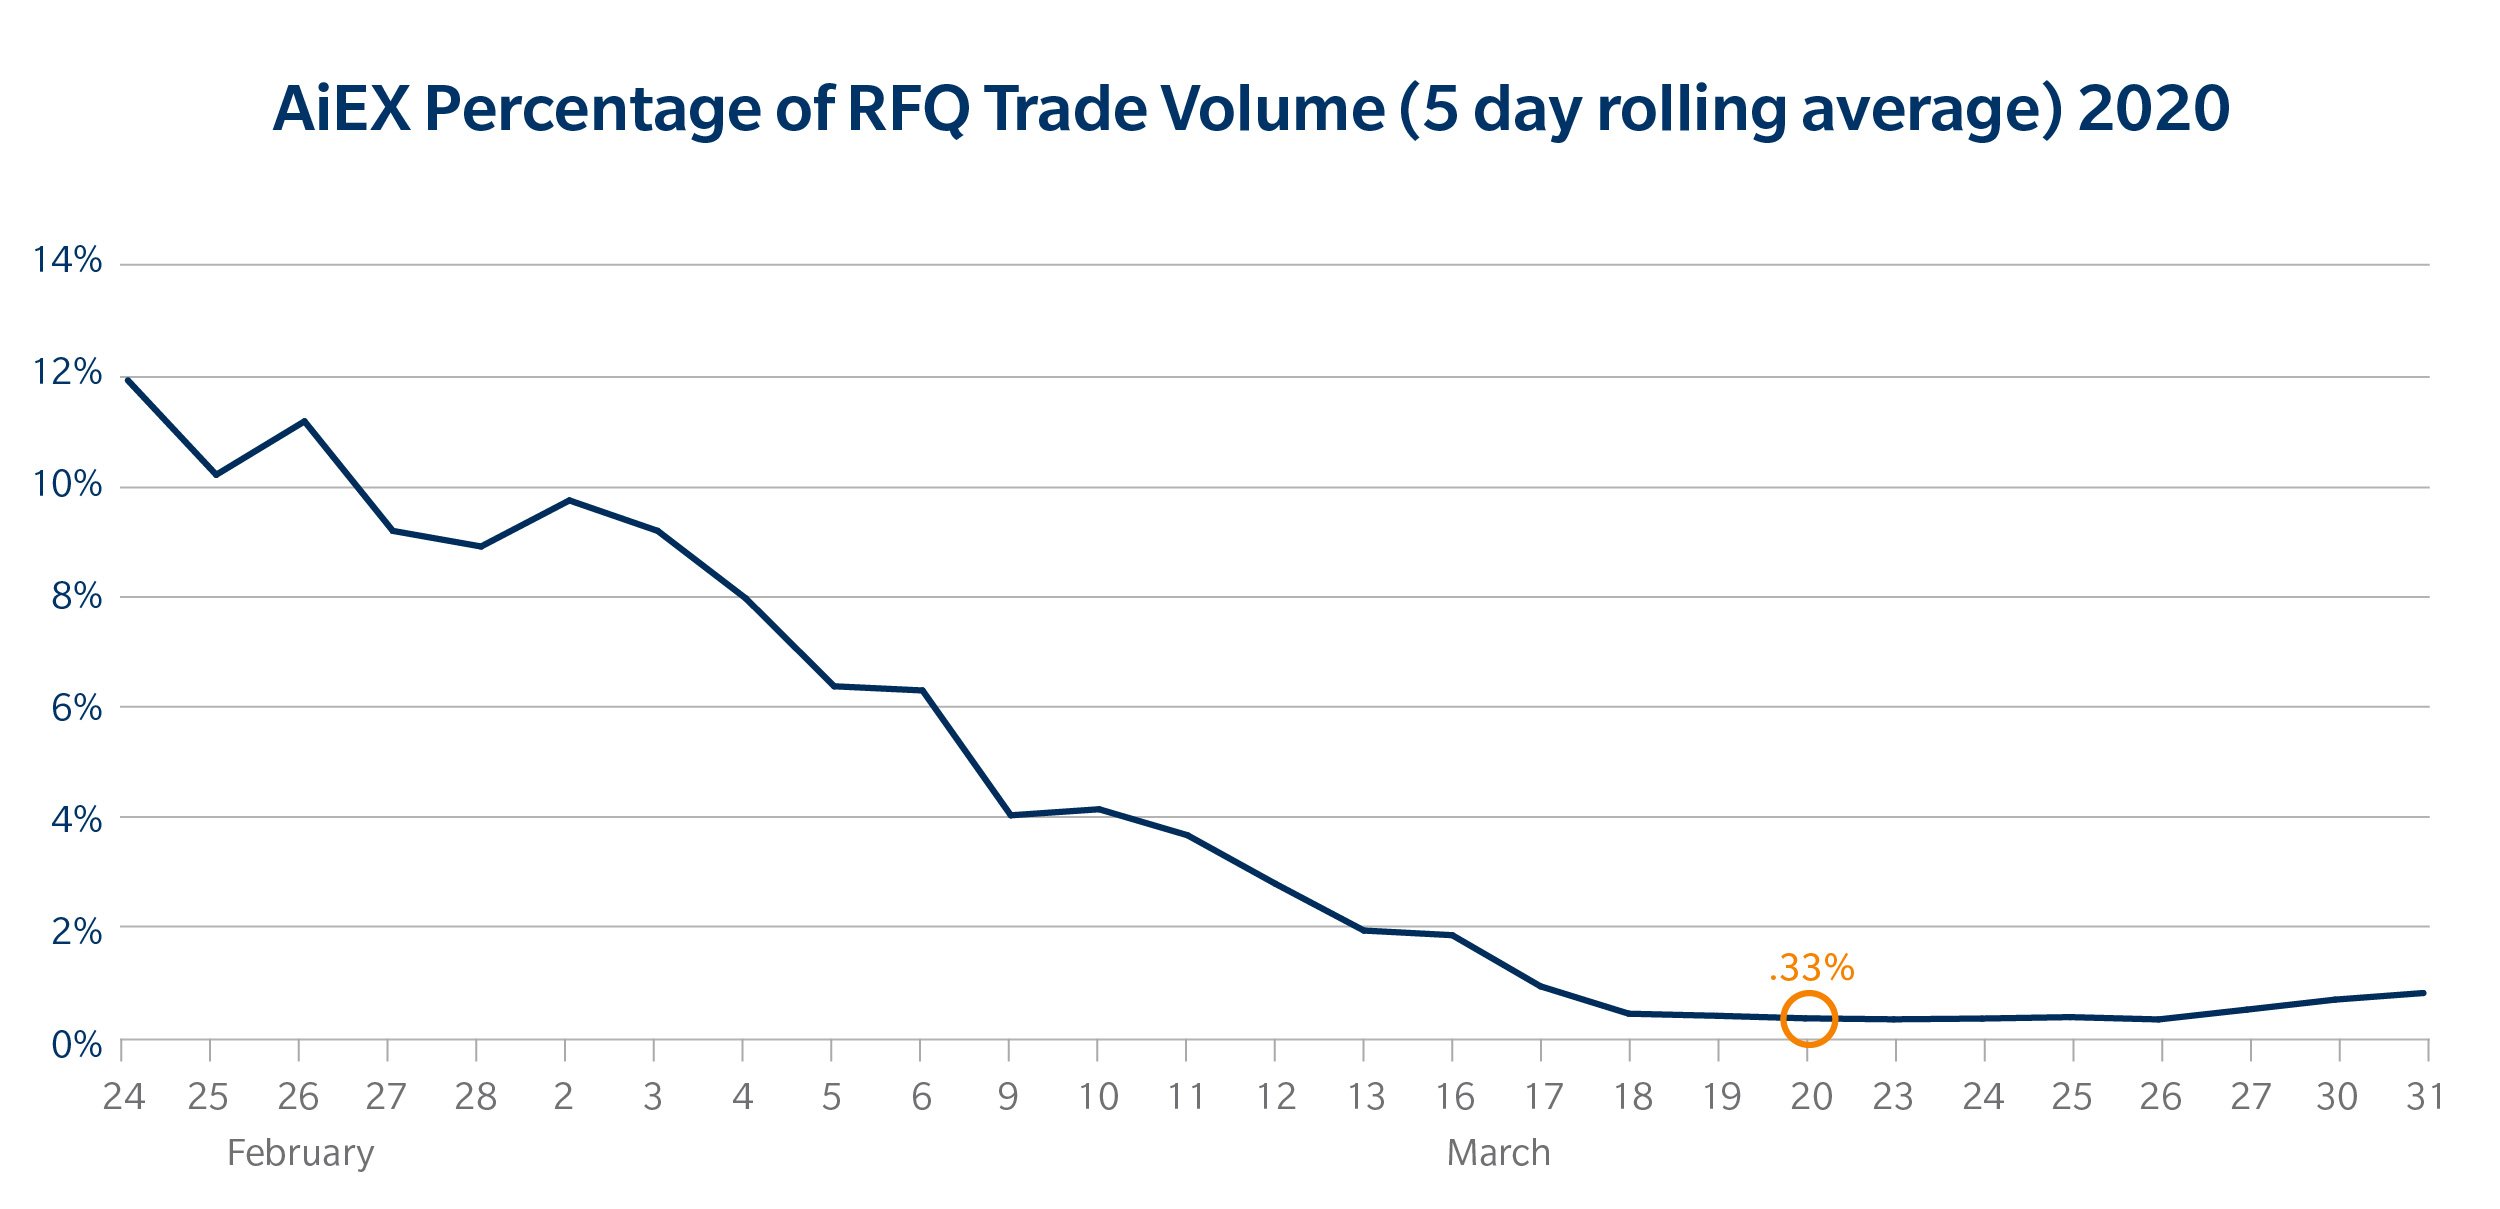
What next?
Credit markets certainly maintained a high degree of functionality in March 2023.
Although we did see general spikes in volume in the financial sector, CS and SIVB have declined back to more normalized volumes and sector volumes have also fallen (though remain slightly higher than their long run average) through May. Tradeweb’s Ai-Price bid/offer spreads remain somewhat higher in the financial sector compared to before the crisis, though have reduced from the peaks in mid-March. Given the broader macro conditions with inflation and interest rate conditions, heightened volatility as a constant theme for the rest of the year would not be surprising.
While it is still far too early to say we’re out of the woods on another possible flare-up in the banking sector, the response of our credit markets to this recent disruption is encouraging.
At Tradeweb we look back at this period as a positive step in the evolution of electronic trading. Coalition Greenwich estimates that 35-40% of Credit is now traded electronically and that trendline did not change, even in an unpredictable environment.
The behavior of electronic credit markets throughout the month of March is analogous to trends we’ve seen in more mature electronic markets like government bonds and mortgages over the course of the last two decades. In the earliest days of electronic trading of U.S. Treasuries, for example, the slightest blip in macroeconomic data would send early adopters back to their phones seeking stability. Over time, these traders began to realize that they actually had more options and better visibility on electronic markets during periods of volatility, and they started riding out the storms electronically. That same gradual adoption curve has been playing out in credit markets over the past few years, and the recent banking crisis has been the first true test of whether we’d reached the tipping point. Based on the data, it is clear credit market participants have made electronic credit trading an essential tool to have on hand for every market scenario.
Related Content
Is This the New Era for Electronic Credit Trading?
Single Name CDS: RFM is Next Frontier for E-Trading in Emerging Markets