Data Points - ETF Update - October 2018
The following data is derived from trading activity on the Tradeweb Markets institutional European- and U.S.-listed ETF platforms.
EUROPEAN-LISTED ETFs
Total traded volume
Activity on the Tradeweb European ETF marketplace soared to a record-breaking EUR 25.9 billion in October, beating February’s previous best performance by EUR 1.9 billion. During the month, the proportion of transactions processed via Tradeweb’s Automated Intelligent Execution (AiEX) tool exceeded 45%, a new monthly record and significantly up from September’s 39.2% figure.
Adriano Pace, head of equities (Europe) at Tradeweb, said: “We saw ETF volumes reach new heights in October, a month that will be remembered for the surge in market volatility, notably affecting U.S. stocks. Despite the market stress, our platform metrics remained strong, and clients were able to unlock liquidity and efficiently execute their orders.”
Volume breakdown
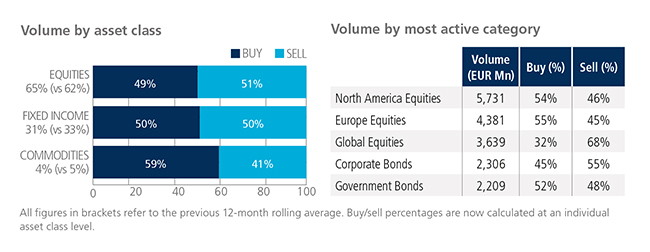
For the first time since June, commodities were predominantly bought in October with a ratio of 59%. Overall activity in the asset class dropped to 4% of the platform flow, trailing the previous 12-month rolling average by one percentage point. In contrast, activity in equity-based ETFs climbed to 65% of the total traded volume, outstripping the previous 12-month rolling average by three percentage points. North America Equities was by far the most heavily-traded ETF category, with more than EUR 5.7 billion in notional volume.

Top ten by traded notional volume
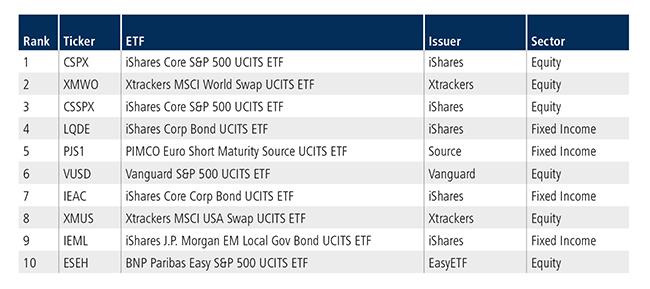
The iShares Core S&P 500 UCITS ETF proved to be October’s most actively-traded fund, after last holding the top spot in October 2016. Overall, the top ten list featured six stocks-based products, with five offering exposure to U.S. equities.

U.S.-LISTED ETFs
Total traded volume
Total consolidated U.S. ETF notional value traded in October 2018 rose 273% year over year to USD 17.4 billion. Total volume traded year to date of USD 81.5 billion has already exceeded full-year 2017 volume of USD 55.2 billion by 47.6%.
Volume breakdown
As a percentage of total notional value, equities accounted for 65.6% and fixed income for 26.5% with the remainder comprised of commodity and specialty ETFs.

Adam Gould, Head of U.S. Equities at Tradeweb, said: “Our prediction in September that the fourth quarter of 2018 would be busy certainly came to fruition - notional value traded this month almost tripled year over year. The rising rates and declining equities of ‘Red October’ were reflected real-time by robust U.S. ETF Trading on Tradeweb, which experienced an outsized concentration in equity focused-fund activity. Throughout, our systems performed efficiently and resiliently, facilitating a number of large single trades.”
Top ten by traded notional volume
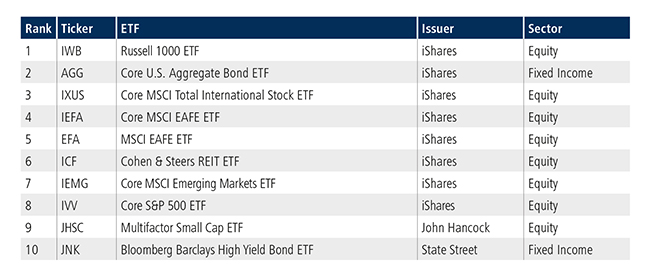
During the month, 625 unique tickers traded on Tradeweb’s U.S. ETF platform. The single most traded ETF by notional value traded during the month was the iShares Russell 1000 ETF (NYSE: IWB). As volatility roiled markets and yields on the 10-year US government bond jumped, so U.S. equities became a focus: eight of the top ten tickers on Tradeweb were equities based.
