Back to the Future: The New (Old) 20Y Nominal Securities and how the market evolved

Jonathan Rick
Director of Research, Tradeweb
Tomorrow the U.S. Treasury will conduct the final reopening of the recently reintroduced 20-year bond. With some semblance of a track record under its belt, albeit early days, we thought now was a good time to examine how the 20-year’s been received and why it matters.
In May, for the first time in over a decade, the market prepared for a new (old) nominal security: the first issuance of a 20-year bond since 1986. Given that U.S. Treasury issuance tends to have regular intervals and relatively predictable and consistent sizes, the addition of more duration to the market is significant.
Not unlike the 2006 reintroduction of the 30-year bond, the new 20-year auction became a focal point for the market. In some respects, the backdrop of the rates landscape was similar when both bonds were reintroduced, with generally low yields. Although only one of them launched in the midst of a global pandemic.
When the U.S. Treasury reintroduced the 30-year, it auctioned off bonds worth $14bn with a then record low yield of 4.53% in February 2006, which compared to closing levels of 4.54% on the 10Y and 4.65% on the 2Y on that day. This made for relatively cheap funding, especially given the duration. Looking at May 2020 when the new 20Y was auctioned off at 1.22%, the U.S. Treasury market closed with levels of 1.40% on the 30Y, 0.68% on the 10Y, and 0.16% on the 2Y – again remarkably cheap funding given the duration! Even the initial issuance size for the new 20Y was noteworthy: at $20bn, it was well above expectations.
The 20Y auction results were pretty in line with other recent long-term issuance. Further, investor participation by class was roughly in line with a typical 10Y or 30Y auction, although there was relatively strong demand from pension, retirement and insurance funds, who bought more in this 20Y auction in May than any 10Y or 30Y nominal bond auction since October 2015, and continued to show demand in the June reopening.[1]
Moreover, during the June reopenings of the three securities, the 20Y saw relatively strong demand, with a relatively high bid-to-cover compared to May’s auction and an auction yield through the 1pm WI level. Meanwhile both the 10Y and 30Y auctions saw bid-to-covers flat to lower compared to May, and yields that saw some concession relative to 1pm WI levels. Following one of the strongest 30Y auctions in years, we will see how the final reopening of the 20Y goes on Wednesday.
The Buyers of the 20Y Look to be in Line with Other Long-Term Debt in May and June[2][3]
|
Auction date |
Security |
Depository |
Individuals |
Dealers |
Pension and |
Investment |
Foreign |
Others |
|---|---|---|---|---|---|---|---|---|
|
12-May-2020 |
10-Year Note |
9.44% |
0.04% |
22.49% |
0.00% |
42.82% |
25.22% |
0.00% |
|
13-May-2020 |
30-Year Bond |
0.05% |
0.03% |
36.29% |
0.00% |
54.97% |
8.65% |
0.01% |
|
20-May-2020 |
20-Year Bond |
0.10% |
0.01% |
28.07% |
0.90% |
57.77% |
13.14% |
0.00% |
|
09-Jun-2020 |
10-Year Note |
0.00% |
0.00% |
33.96% |
0.00% |
53.71% |
12.32% |
0.00% |
|
11-Jun-2020 |
30-Year Bond |
0.00% |
0.00% |
29.24% |
0.00% |
62.51% |
8.25% |
0.00% |
|
17-Jun-2020 |
20-Year Bond |
0.00% |
0.01% |
26.11% |
0.06% |
57.42% |
16.41% |
0.00% |
Still, there are other interesting things about the reintroduction of the 20Y that we think merit further examination. We wanted to examine both the evolution of trading in the new issue as well as historically how activity in new benchmarks has progressed.
We’ve found:
- Evolution of price formation of the new 20Y was consistent with typical When-Issued trading
- As we’ve seen historically, this new benchmark has been additive to on-the-run trading activity
- Over time, the market has seen a relative rise in long tenor trading coincident to an increase in back-end issuance.
Price Makers
Like other new U.S. Treasury securities, the When-Issued (WI) 20Y became active for Tradeweb institutional clients on its announcement date – in this case May 14th, 2020. The WI market for this security generally developed like that of the other long-term securities (i.e, 10Y note, 30Y bond) with virtually the same number of liquidity providers prior to the auction.
As with other Treasury securities, the auction acted as the liquidity event. The numbers of liquidity providers sending indicative quotes on the first day following the auction (i.e., the first day the security was an “on-the-run”) grew in line with typical participation for an on-the-run. Moreover, actual pricing updates during U.S. trading hours[4] were in-line with pricing updates for the long bond.
Evolution of Trading Activity
Given the extraordinary times that the new 20Y was launched in, we are hesitant to draw too many conclusions from early trading activity in the new security. However, in both institutional and wholesale client sectors, the new security activity has shown no signs of cannibalizing trading activity in on-the-run (OTR) trading of either the 10Y or 30Y securities. Moreover, in the last two month’s OTR 10Y and 30Y institutional trading activity is up 13% and 47%, respectively, compared to May and June of 2019.
As Tradeweb has been facilitating electronic trading of U.S. Treasuries since our foundation in 1997, we can look at how trading activity evolved in previous episodes when the Treasury launched a new maturity. We think that the two most instructive comparisons are what happened to daily volumes when the Treasury reintroduced the 30Y bond in 2006 and the 7Y note in 2009.[5] In both instances, the new maturity had limited impact on other benchmark securities and resulted in additive trading volume.
For simplicity, we focused on on-the-run trading of our institutional clients during the launch of these securities over a decade ago.
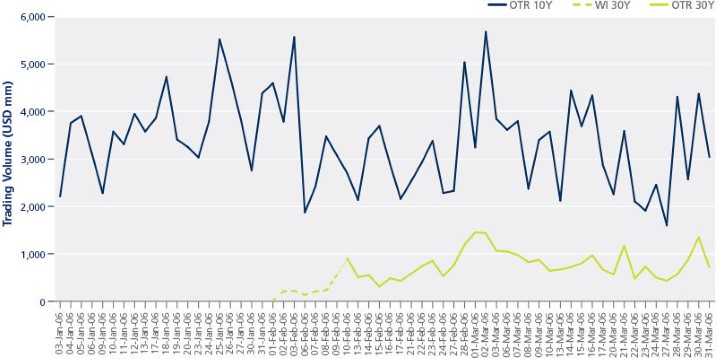
Reintroduction of the 30Y Bond
In January and February 2006, up until the February auction on the 8th, the on-the-run 10Y (912828EN6) had an average daily volume of $3.7bn on Tradeweb. The new 10Y issue (912828EW6) finished February with an ADV of $3.0bn[6], which then rose to $3.3bn in March. Meanwhile, the new 30Y bond (912810FT0) had an ADV of $650mm in February and $847mm in March. When taking into account duration, the introduction of the new long bond was accretive to on-the-run trading when it was launched.
The Reissuance of the 30Y did not materially impact 10Y On-The-Run Note Trading
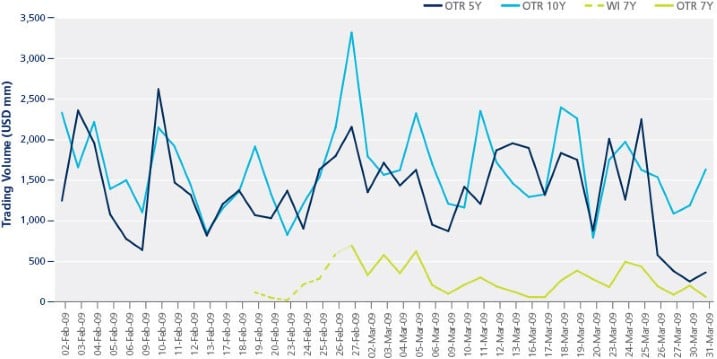
Reintroduction of the 7Y Note
In February 2009, up until the February auction on the 11th, the on-the-run 10Y (912828JR2) had an average daily volume of $1.8bn on Tradeweb. The new 10Y issue (912828KD1) finished February with an ADV of $1.6bn[7], which remained around that level in March. Meanwhile, the on-the-run 5Y (912828JZ4) had an ADV of $1.3bn in February, while the new OTR (912828KF6), auctioned on February 25th, saw a slight uptick to $1.5bn in March. While it was the on-the-run, the newly issued 7Y (912828KS8) had an ADV of $0.3bn. Again, the new 7Y was accretive to overall on-the-run trading activity.
The Reissuance of the 7Y did not materially impact 5Y nor 7Y On-The-Run Note Trading
Adding Duration
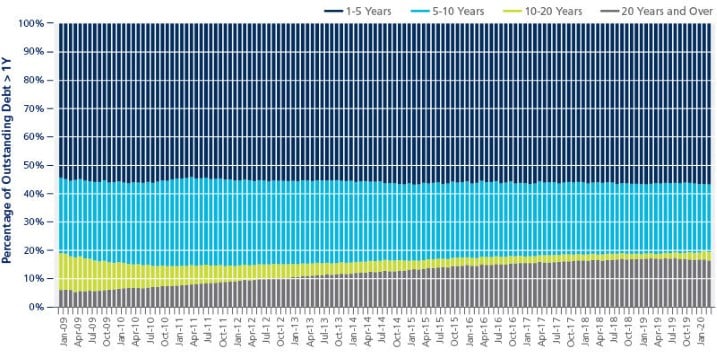
In 2009, and among other actions, the U.S. Treasury began a long-term campaign to increase the maturity profile of its overall debt by increasing issuance in long-dated securities. This has extended the average maturity of government securities outstanding from ~50 months to its current levels ~70 months.[8] Long dated issuance has now grown from ~5% of total nominal coupon issuance to ~9% of an ever growing total issuance in the first calendar quarter of 2020.[9] With this shift, we have seen the bond sector become an increasing percentage of Treasuries notes and bonds outstanding[10]. Treasury Bonds that have a maturity of 20 years and over currently comprise more than 16% of the total, a doubling from 2011.
At Tradeweb, this has had an impact on the makeup of trading activity in the government bond market, with trading in longer term securities becoming an increasing proportion of trading activity. This is obvious on the Tradeweb institutional platform, where steady growth in long-term debt issuance means ≥20 year bonds now represents 12.0% of nominal coupon volume vs 7.3% in 2014.
Bonds have become an Increasing Proportion of U.S. Treasury Debt Outstanding
Conclusion
In the end, one of the most interesting outcomes of the new 20Y auction is how uneventful the event itself actually was. One could chalk this up, in part, to the benefits of the “regular and predictable” auction strategy that the U.S. Treasury adopted for all marketable securities after observing issues with auctions in 1975, during another period of rapid expansion of the federal deficit.[11] It also helps that the Treasury works with market participants to ensure orderly trading of its debt – and indeed it appeared market participants were well-prepared. With the continued growth in the issuance of long-term bonds, the power of a well-functioning electronic market built with its customers in mind, like Tradeweb, is essential to ensuring transparent and robust liquidity in one of the most important markets in the world.
Related Content
The Election and U.S. Treasuries: It’s About Context
Record Fixed-Income Issuance Spurring Changes in Trading, Market Dynamics
[1] https://home.treasury.gov/data/investor-class-auction-allotments
[2] Ibid
[3] Excluding Federal Reserve SOMA holdings
[4] 7:30am – 5:00pm EDT
[5] It also reintroduced the 3Y note in both 2003 and 2008, but we do not feel it is a relevant comparison for a number of reasons.
[6] Average daily volumes for new issues based on trading days following the date of its auction up until the auction of a new CUSIP
[7] Average daily volumes for new issues based on trading days following the date of its auction up until the auction of a new CUSIP
[8] Q2 2020 U.S. Treasury Refunding Documents, https://home.treasury.gov/policy-issues/financing-the-government/quarterly-refunding/most-recent-quarterly-refunding-documents
[9] Ibid.
[10] Ibid. Based on maturity distribution of marketable debt outstanding with maturity greater than 1 year.
[11] https://www.newyorkfed.org/research/epr/07v13n1/garbade/exesum_garb.html
This is sales and trading commentary, not official research. Not intended as investment advice.