Record Fixed-Income Issuance Spurring Changes in Trading, Market Dynamics

Jonathan Rick
Director of Research, Tradeweb
Issuance has flooded the fixed-income markets this year, breaking or pacing toward new annual records across sectors and geographies. Here at Tradeweb we’re analyzing how all this new issuance affects everything from trading volumes to the mechanics of the market. This month we’re looking at U.S. Treasuries, where an unprecedented amount of issuance is driving corresponding surges in bill and bond trading.
But first, viewing fixed income as a whole, issuance is racing toward historic annual highs as governments respond to liquidity concerns caused by the global coronavirus pandemic and corporates take advantage of record-low yields. U.S. Treasury gross issuance, at $15.5tn, has already surpassed 2019’s record year. [1] The federal government’s reintroduction of the 20Y bond and its announcement of plans to issue more longer-dated maturities has bond-sector issuance of nominal securities on pace to double that of last year.
Euro-zone governments, meanwhile, have already sold €2.5tn of new debt in 2020, surpassing full-year issuance back to 2015.[2] The rise in supply this year is a noticeable reversal of the general trend lower since the peak of the European debt crisis in the early part of the 2010s.
Further, U.S. corporates have issued $1.9tn of debt so far this year, up 70% from last year’s pace and easily surpassing 2017’s record $1.6tn of issuance.[3] Low interest rates have girded a corporate-issuance frenzy in the last decade, with total issuance up 68% from the 2000s.[4] Meanwhile in the EU, corporate issuance is up over 90% in the same period, and with over €750bn issued so far this year, is tracking 14% higher than last year’s record issuance. [5]
Corporates and governments are leveraging up - the amount of new debt is well outpacing the amount of debt being retired. That means more debt outstanding to trade. It also means a greater diversity among the instruments available. And while it’s true that not every bond is traded all the time - and certain issues are more liquid than others - unrelenting new issuance is broadening the universe of unique bonds trading daily. 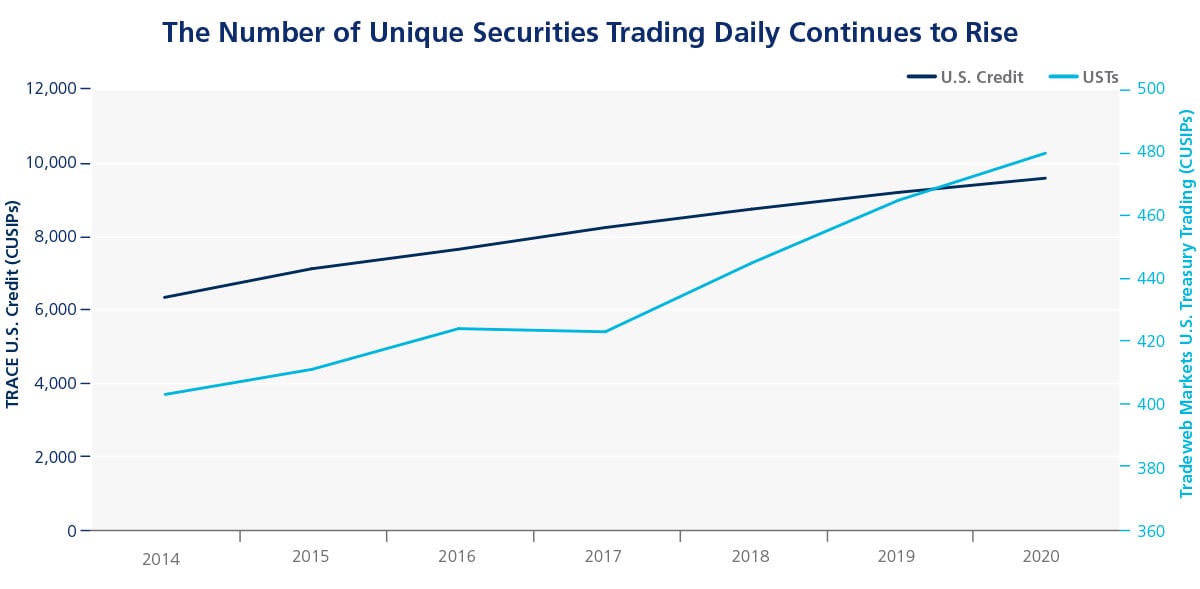
We’ve seen no indication that trading desks are proportionally expanding to accommodate this growth, which means traders must find ways to do more with less. Some have learned to rely more heavily on technology - from simple databases to OMS/EMS to trading venues and beyond - to better track an increasingly diverse set of securities, manage multifactor market risk and execute trades.
We’re watching the markets, tracking issuance and analyzing how all this new debt will affect ongoing market dynamics, while helping our clients better manage and optimize their trading strategies.
Focus: US Treasuries
With more than $20tn of debt outstanding, the U.S. Department of the Treasury is the largest single issuer in the world. Its “regular and predictable” auction cycle supports liquidity for the government’s ever-increasing financing needs, including the more than $2tn of new debt sold in March during escalation of the coronavirus pandemic.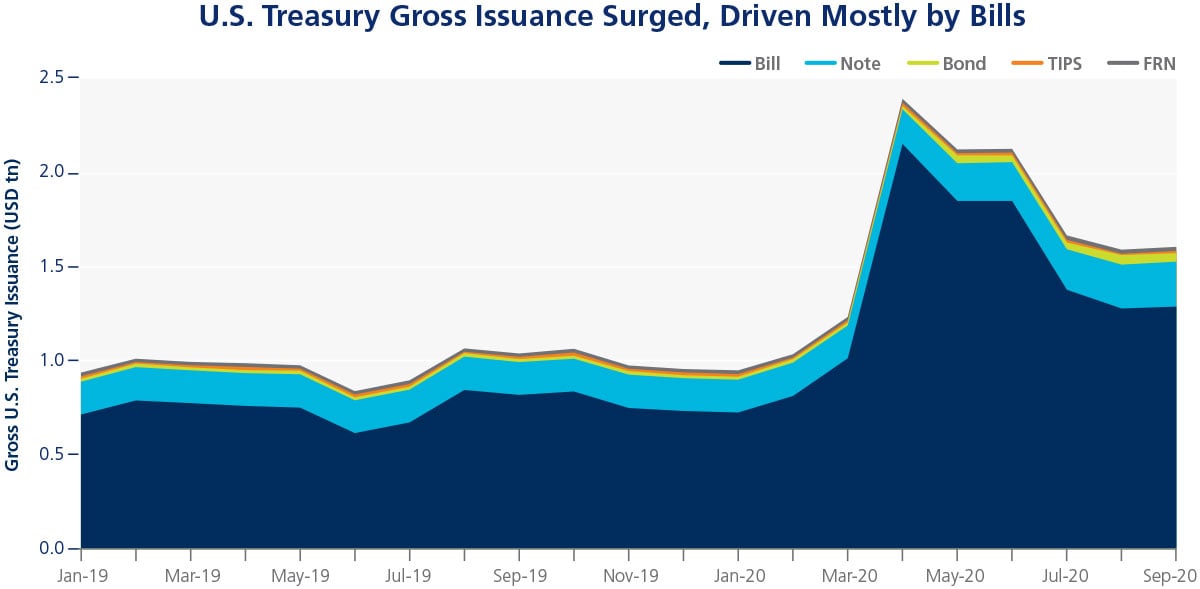
Gross issuance in U.S. Treasuries has been going up for years. Issuance last year, at $12.1tn, was 15% higher than in 2018; note and bond issuance was up 9.3% to $2.9tn.[6]
Through the crisis and over the summer, trading in US Treasuries has remained robust, averaging over $600bn a day, according to TRACE.
To understand the impact of new Treasuries issuance on trading, Tradeweb built a simple regression model,[7] using issuance and delivered volatility[8] to examine trends across multiple factors, including maturity sectors and vintages. We focused on our institutional clients only and excluded volume generated from hedging other products.[9]
When looking at trading across maturities, the most obvious impact can be seen in the bill sector[10], where monthly issuance of bills more than doubled in March. Trading volumes increased roughly in line with the increase in issuance; they have persisted at elevated levels, however, despite the subsequent decline in issuance. This could suggest that there might be some persistence in elevated trading from the shock of issuance in March and the elevated level of debt outstanding in the sector, although it is too early to determine how long this will last.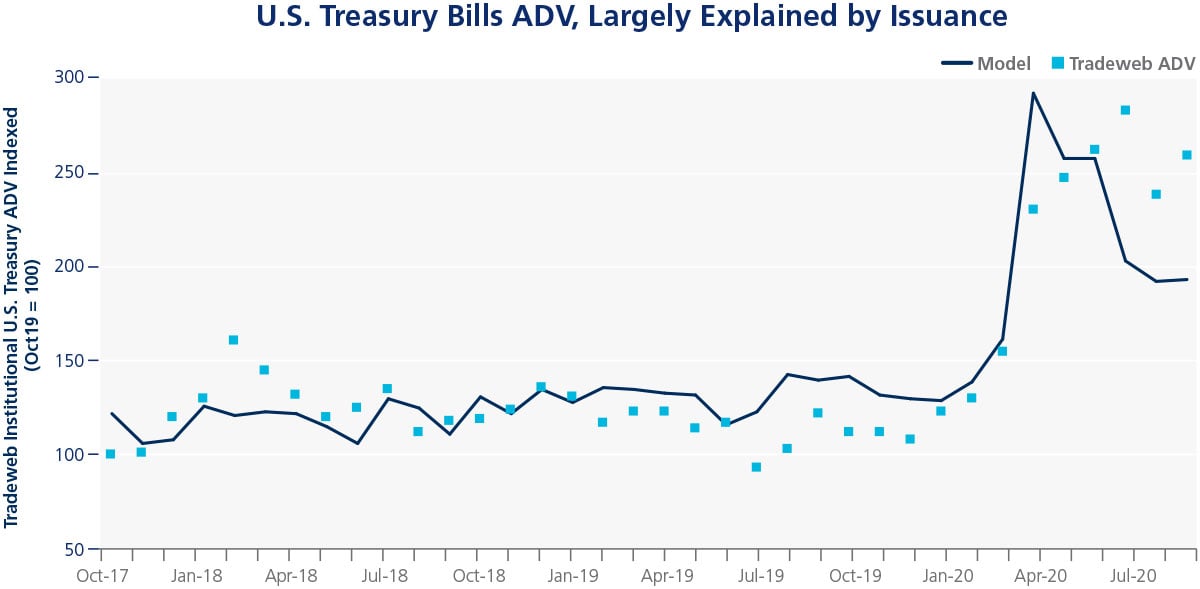
Volatility and issuance both had a significant impact on bond trading, too. Bond trading ticked up commensurate with the general rise in issuance over the preceding quarters, and the reintroduction of the 20Y appears to have resulted in a level shift in bond trading.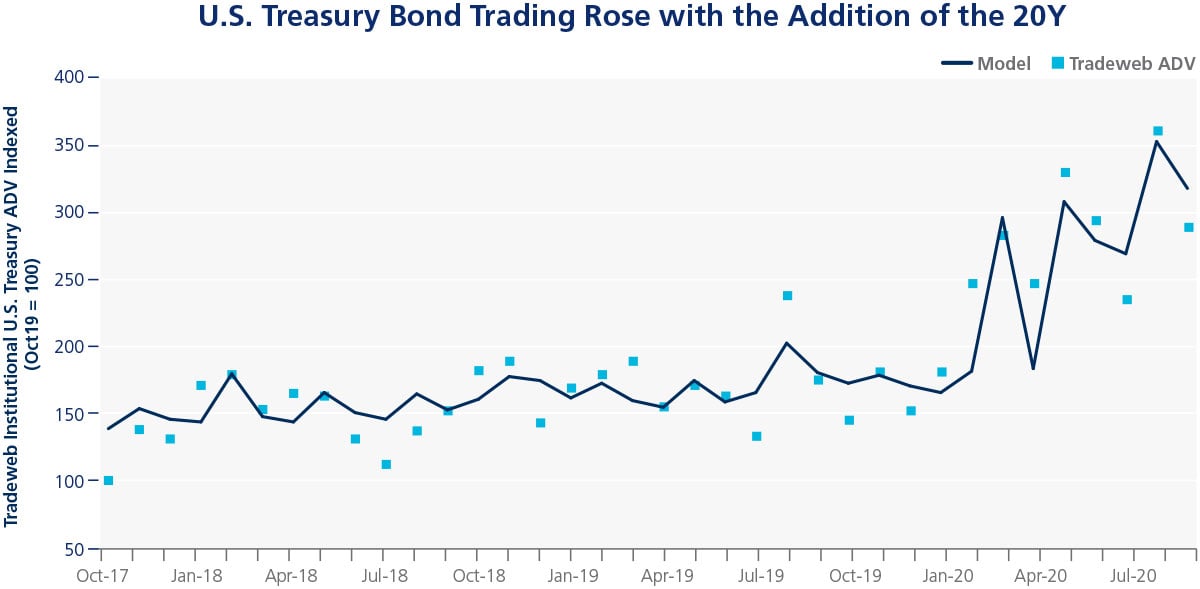
Our model didn’t have strong explanatory power with regard to note trading volume. That would suggest that other factors are more strongly influencing the sector.
Additionally, we looked at the impact of volumes broken down between on-the-run (OTR) and off-the-run (OfTR) activity. We have seen a rise in OfTR activity since March. However, most of it is in the bill sector, particularly in volumes of cash management bills (CMBs), where issuance has surged in recent months. That seems to explain most of the rise recently in OfTR trading.
Next month, we’ll analyze corporate bonds and how this year’s record-breaking issuance is sparking changes in trading protocols.
Related Content
The Election and U.S. Treasuries: It’s About Context
Back to the Future: The New (Old) 20Y Nominal Securities and how the market evolved
[1] Source: SIFMA, through Sep20. https://www.sifma.org/resources/research/us-marketable-treasury-issuance-outstanding-and-interest-rates/
[2] Source: ECB, through Aug20. https://sdw.ecb.europa.eu/quickview.do?SERIES_KEY=325.GFS.M.N.I8.W0.S13.S1.N.LI.F.F3.T._Z.EUR._T.F.V.N._T
[3] Source: SIFMA, through Sep20. https://www.sifma.org/resources/research/us-corporate-bond-issuance/
[4] Ibid.
[5] Source: ECB, through Aug20. Long-term financial and non-financial corporate debt (All currencies). https://www.ecb.europa.eu/stats/financial_markets_and_interest_rates/securities_issues/debt_securities/html/index.en.html
[6]Source: SIFMA, through Sep20. https://www.sifma.org/resources/research/us-marketable-treasury-issuance-outstanding-and-interest-rates/
[7] We used a general ordinary least squares model and normalized the two independent variables.
[8] We used Garman-Klass volatility.
[9] E.g., Swap Spreads, Credit hedges, MBS hedges.
[10] Given the limited impact of volatility in the Bills sector we excluded it from our model in that sector.