Tradeweb Reports December 2023 Total Trading Volume of $28.9 Trillion and Average Daily Volume of $1.46 Trillion
Month of December 2023 ADV up 43.3% YoY
Fourth Quarter 2023 ADV up 56.9% YoY
Full Year 2023 ADV up 27.6% YoY
NEW YORK – January 4, 2023 – Tradeweb Markets Inc. (Nasdaq: TW), a leading, global operator of electronic marketplaces for rates, credit, equities and money markets, today reported total trading volume for the month of December 2023 of $28.9 trillion (tn). Average daily volume (ADV) for the month was $1.46tn, an increase of 43.3 percent (%) year-over-year (YoY). For the fourth quarter of 2023, total trading volume was $104.4tn and ADV was $1.68tn, an increase of 56.9% YoY, with preliminary average variable fees per million dollars of volume traded of $2.54.[1]
Billy Hult, Tradeweb CEO, said: “Historic interest rate moves, geopolitical uncertainty and ongoing market volatility helped drive a 2023 resurgence in fixed income. Despite a challenging start to the year, we reported a 27.6% YoY increase in average daily volume for the full year and broke numerous volume records across rates, credit, equities and money markets. The fourth quarter was particularly strong in rates, and in December we reported a record 18.2% share of fully electronic U.S. High Grade TRACE for the month.”
Record Highlights (See table below for the full breakdown of volumes)
The month of December 2023 Tradeweb records included:
- Share of fully electronic U.S. High Grade TRACE
- ADV in U.S. ETFs
- ADV in equity convertibles/swaps/options
Fourth quarter 2023 Tradeweb records included:
- ADV in U.S. government bonds
- ADV in swaps/swaptions ≥ 1-year
- Share of and ADV in fully electronic U.S. High Grade TRACE
- ADV in equity convertibles/swaps/options
- ADV in global repurchase agreements
Full year 2023 Tradeweb records included:
- ADV in U.S. government bonds
- ADV in European government bonds
- ADV in swaps/swaptions ≥ 1-year
- Share of and ADV in fully electronic U.S. High Grade and U.S. High Yield TRACE
- ADV in European credit
- ADV in Chinese bonds
- ADV in U.S. ETFs
- ADV in equity convertibles/swaps/options
- ADV in global repurchase agreements
The month of December 2023 Highlights
RATES
- U.S. government bond ADV was up 39.8% YoY to $159.5 billion (bn). European government bond ADV was up 21.5% YoY to $33.4bn.
- U.S. government bond volumes were supported by growth across all client sectors, increased adoption across a diverse set of trading protocols on the institutional platform and sustained rates market volatility. Higher interest rates continued to drive trading in the retail market. European government bond volumes were supported by sustained rates market volatility and strong hedge fund activity.
- Mortgage ADV was up 34.1% YoY to $175.1bn.
- To-Be-Announced (TBA) platform volumes were supported by the broader rates market rally as well as strong coupon swap and roll trading activity. Robust client engagement in specified pool trading reflected growing adoption of our list trading tool YoY.
- Swaps/swaptions ≥ 1-year ADV was up 80.1% YoY to $336.5bn and total rates derivatives ADV was up 62.0% YoY to $513.2bn.
- Strong volume in swaps/swaptions ≥ 1-year was driven by increased activity in longer-duration swaps as well as an 85% YoY increase in compression activity, which carries a lower fee per million. 4Q23 compression activity was higher than 3Q23. Growing volumes in the request-for-market (RFM) protocol and inflation swaps contributed to strong activity for the month.
CREDIT
- Fully electronic U.S. credit ADV was up 56.4% YoY to $5.6bn and European credit ADV was up 26.2% YoY to $1.6bn.
- Strong U.S. credit volumes were driven by increased client adoption of Tradeweb protocols, most notably in request-for-quote (RFQ), portfolio trading and Tradeweb AllTrade. Tradeweb captured a record 18.2% share of fully electronic U.S. High Grade TRACE, and 6.5% share of fully electronic U.S. High Yield TRACE. European credit volumes were supported by strong activity in portfolio trading and Tradeweb Automated Intelligent Execution (AiEX), as well as increased client adoption of our smart dealer selection tools and Tradeweb AllTrade protocols. Overall, global portfolio trading ADV was up 87% YoY.
- Municipal bonds ADV was down 5.3% YoY to $414 million (mm).
- While outpacing the -14% drop in the broader market[2], municipal trading volume slowed marginally, as retail investors digested lower yields and institutional tax-loss harvesting activity waned.
- Credit derivatives ADV was down 4.9% YoY to $7.5bn.
- Tight credit spreads and low market volatility led to slightly lower overall swap execution facility (SEF) market activity.
EQUITIES
- U.S. ETF ADV was up 44.3% YoY to $10.9bn and European ETF ADV was up 29.1% YoY to $3.2bn.
- Institutional platform volumes in both U.S. and Europe were strong, with U.S. volumes up 12.8% YoY.
MONEY MARKETS
- Repurchase agreement ADV was up 34.2% YoY to $508.7bn.
- Increased client adoption of Tradeweb’s electronic trading solutions drove global repo activity. Quantitative tightening, heightened collateral supply and current rates market activity shifted demand from the Federal Reserve’s reverse repo facility to money markets. Retail money markets activity continued to be strong as interest rates remained elevated.
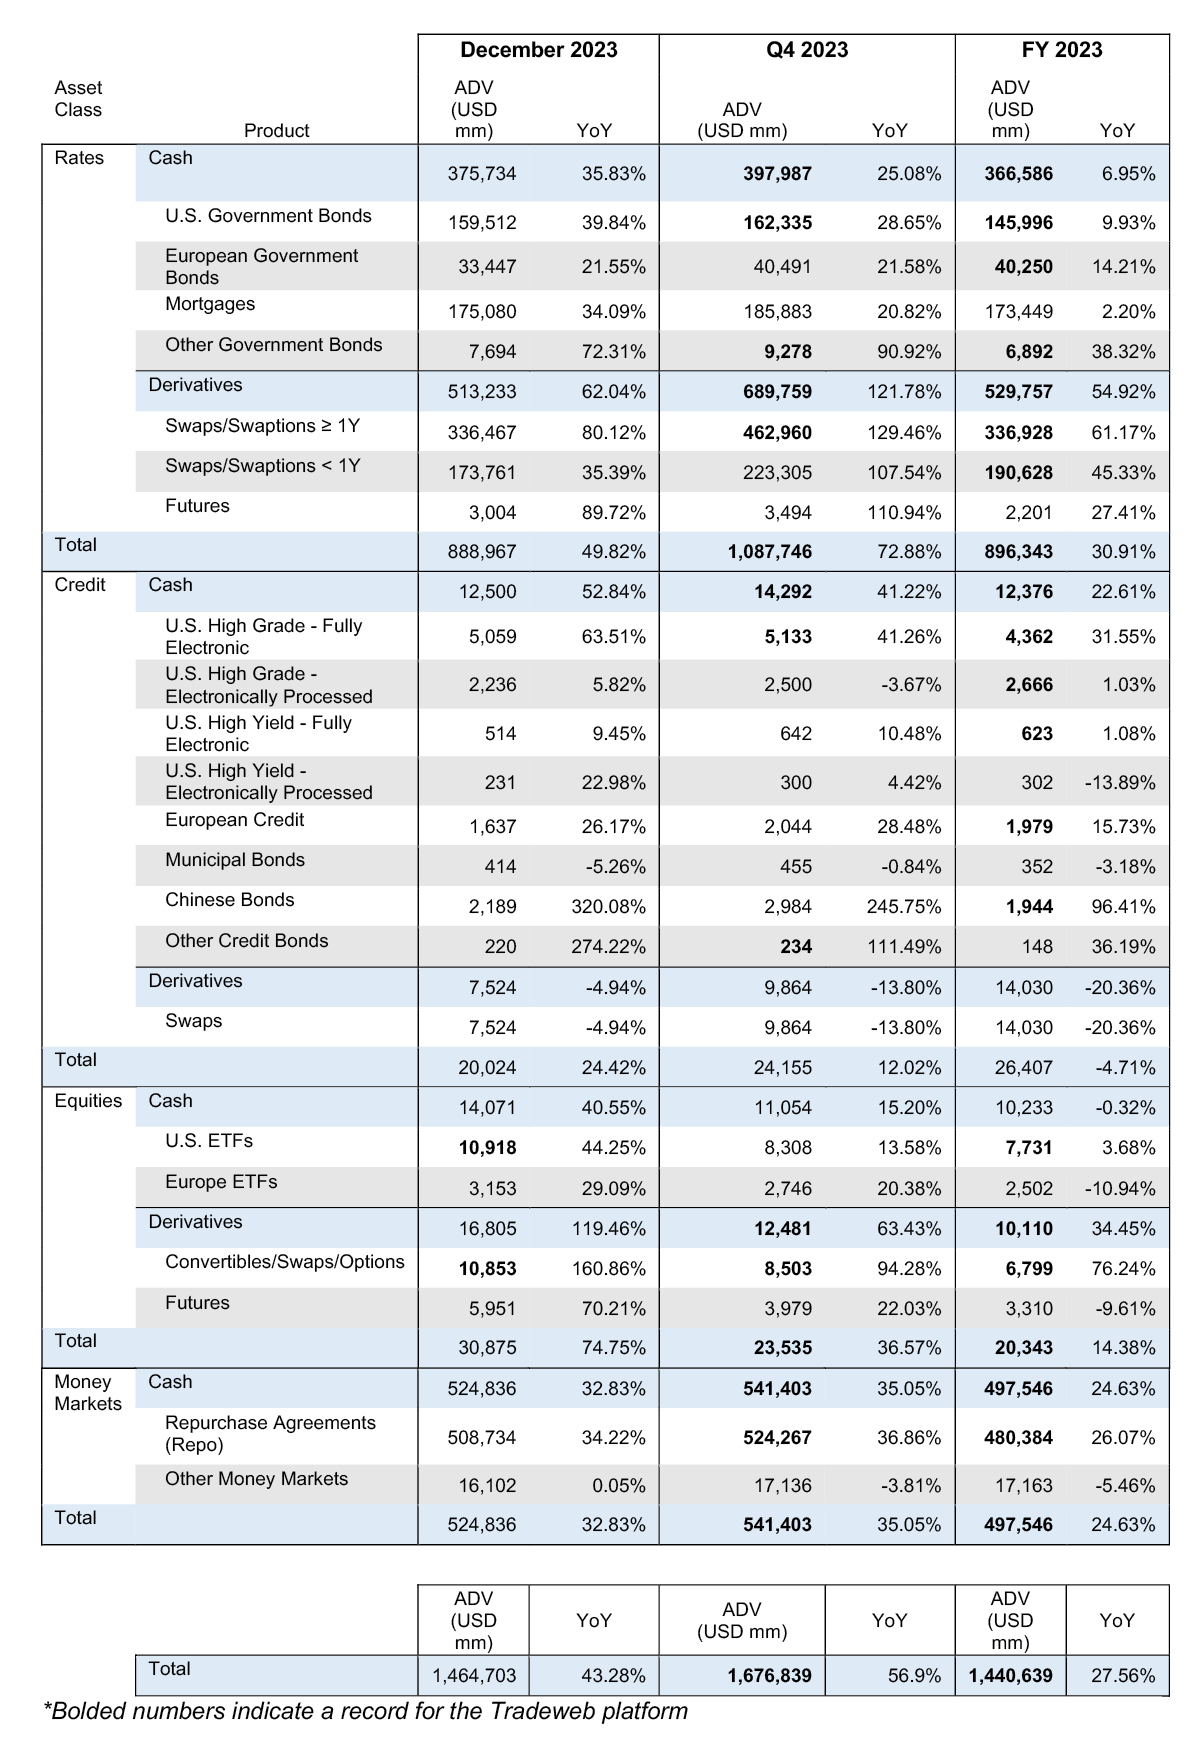
YoY Volume for the Month of December 2023, Q4 2023 and Full Year (FY) 2023
Please refer to the report posted to https://www.tradeweb.com/newsroom/monthly-activity-reports/ for complete information and data related to our historical monthly, quarterly and yearly ADV and total trading volume across asset classes.
About Tradeweb Markets
Tradeweb Markets Inc. (Nasdaq: TW) is a leading, global operator of electronic marketplaces for rates, credit, equities and money markets. Founded in 1996, Tradeweb provides access to markets, data and analytics, electronic trading, straight-through-processing and reporting for more than 40 products to clients in the institutional, wholesale and retail markets. Advanced technologies developed by Tradeweb enhance price discovery, order execution and trade workflows while allowing for greater scale and helping to reduce risks in client trading operations. Tradeweb serves more than 2,500 clients in more than 65 countries. On average, Tradeweb facilitated more than $1.4 trillion in notional value traded per day over the past four quarters. For more information, please go to www.tradeweb.com.
Media Contact:
Daniel Noonan, Tradeweb
+1 646 767 4677
Daniel.Noonan@Tradeweb.com
Investor Contacts:
Ashley Serrao, Tradeweb
+1 646 430 6027
Ashley.Serrao@Tradeweb.com
Sameer Murukutla, Tradeweb
+1 646 767 4864
Sameer.Murukutla@Tradeweb.com
Basis of Presentation
All reported amounts are presented in U.S. dollars, unless otherwise indicated. In determining the reported U.S. dollar amounts for non-U.S. dollar denominated securities, the non-U.S. dollar amount for a particular month is translated into U.S. dollars based on the monthly average foreign exchange rate for the prior month. Please see the footnotes on page 3 of the full report for information regarding how we calculate market share amounts presented in this release.
Market and Industry Data
This press release and the complete report include estimates regarding market and industry data that we prepared based on our management’s knowledge and experience in the markets in which we operate, together with information obtained from various sources, including publicly available information, industry reports and publications, surveys, our clients, trade and business organizations and other contacts in the markets in which we operate. In presenting this information, we have made certain assumptions that we believe to be reasonable based on such data and other similar sources and on our knowledge of, and our experience to date in, the markets in which we operate. While such information is believed to be reliable for the purposes used herein, no representations are made as to the accuracy or completeness thereof and we take no responsibility for such information.
Forward-Looking Statements
This release contains forward-looking statements within the meaning of the federal securities laws. Statements related to, among other things, our outlook and future performance, the industry and markets in which we operate, our expectations, beliefs, plans, strategies, objectives, prospects and assumptions and future events are forward-looking statements.
We have based these forward-looking statements on our current expectations, assumptions, estimates and projections. While we believe these expectations, assumptions, estimates and projections are reasonable, such forward-looking statements are only predictions and involve known and unknown risks and uncertainties, many of which are beyond our control. These and other important factors, including those discussed under the heading “Risk Factors” in documents of Tradeweb Markets Inc. on file with or furnished to the SEC, may cause our actual results, performance or achievements to differ materially from those expressed or implied by these forward-looking statements. In particular, preliminary average variable fees per million dollars of volume traded are subject to the completion of management’s final review and our other financial closing procedures and therefore are subject to change. Given these risks and uncertainties, you are cautioned not to place undue reliance on such forward-looking statements. The forward-looking statements contained in this release are not guarantees of future performance and our actual results of operations, financial condition or liquidity, and the development of the industry and markets in which we operate, may differ materially from the forward-looking statements contained in this release. In addition, even if our results of operations, financial condition or liquidity, and events in the industry and markets in which we operate, are consistent with the forward-looking statements contained in this release, they may not be predictive of results or developments in future periods.
Any forward-looking statement that we make in this release speaks only as of the date of such statement. Except as required by law, we do not undertake any obligation to update or revise, or to publicly announce any update or revision to, any of the forward-looking statements, whether as a result of new information, future events or otherwise, after the date of this release.
[1]See pg. 7 of the report available at https://www.tradeweb.com/newsroom/monthly-activity-reports/ for the detailed breakdown of average variable fees per million dollars of volume traded for each underlying asset class.
[2] Based on data from MSRB