Market Snapshot: U.S. 1yr, 2yr Yields Hit Highs and Euro Government Bonds Soar Following ECB Meeting
Yields on core and peripheral European government bonds soared today following the ECB meeting, according to data from Tradeweb.
ECB President Mario Draghi announced that the deposit rate would be cut to -0.3% from -0.2%, increasing the number of bonds available for purchase, and an expansion of monetary stimulus. Below were the yields on core and peripheral government bonds as of 1:44 PM EST, following the ECB statement:
German 10-Year Bund: 0.679%, up 20.6 bps from yesterday’s close of 0.473%
U.K. 10-Year Gilt: 1.894%, up 14.6 bps from yesterday’s close of 1.748%
Italian 10-Year Bond: 1.657%, up 26.4 bps from yesterday’s close of 1.393%
Spanish 10-Year Bond: 1.732%, up 24 bps from yesterday’s close of 1.492%
Portuguese 10-Year Bond: 2.512%, up 23.6 bps from yesterday’s close of 2.276%
Irish 10-Year Bond: 1.222%, up 21.6 bps from yesterday’s close of 1.006%
The bid yield on the German 2-year note was -0.293%, up 14.1 bps from yesterday’s close of -0.434%. Today’s intraday high was -0.280%, while the intraday low was -0.441%
In the U.S., the bid yield on the bid yield on the 1-year U.S. Treasury note was 0.546% as of 1:44 PM EST, up 4.4 bps from yesterday’s close of 0.502%. Today’s intraday high was 0.551%, while the intraday low was 0.500%. The last time the intraday yield on the 1-year note was this high was on July 1, 2009, when it touched 0.565%.
The bid yield on the bid yield on the 2-year U.S. Treasury note was 0.990% as of 1:44 PM EST, up 8.3 bps from yesterday’s close of 0.907%. Today’s intraday high was 0.990%, while the intraday low was 0.935%. The last time the intraday yield on the 2-year note was this high was on April 30, 2010, when it touched 1.016%.
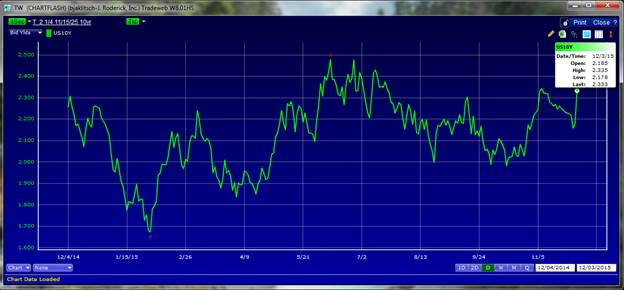
The bid yield on the 10-year U.S. Treasury note was 2.333% as of 1:44 PM EST, up 17.6 bps from yesterday’s close of 2.157%. Today’s intraday high was 2.335%, while the intraday low was 2.178%.
These moves follow the release of weekly jobless claims showing an increase to 269,000 from the prior week’s unadjusted 260,000 figure and ongoing speculation of rate increase from the Fed.
The charts below are based on indicative, real-time data from Tradeweb.
CHART 1: U.S. 1-Year Treasury Yields – December 4, 2014 – December 3, 2015 (12 Month View)
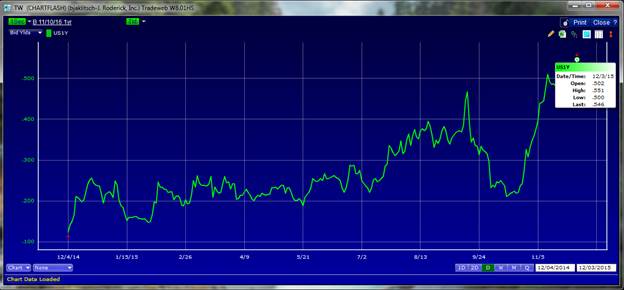
CHART 2: U.S. 2-Year Treasury Yields – December 4, 2014 – December 3, 2015 (12 Month View)
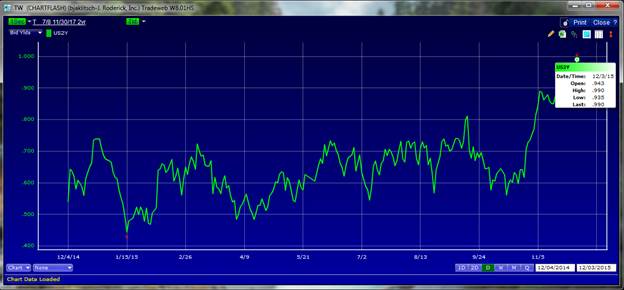
CHART 3: U.S. 10-Year Treasury Yields – December 4, 2014 – December 3, 2015 (12 Month View)