Liquidity is in the Eye of the Beholder

How Directional Liquidity Scoring Spotlights the Ability to Buy and Sell a Bond
“Water, water everywhere, nor any drop to drink,” the oft-quoted line from Coleridge’s The Rime of the Ancient Mariner does well to describe the dilemma of sailors out far on the ocean. However, much like parched sailors tantalized by the seawater surrounding them, bond traders might often find themselves unable to buy or sell a bond, despite trades being printed all around them in a seemingly liquid instrument. The latter’s plight highlights a potential drawback of most measures of liquidity. These traditional liquidity scores for credit bonds in both developed and emerging markets are agnostic of the direction in which the trader is hoping to transact. That’s great if there is equal market demand on either side of the trade. It’s not so great when that balance is tilted in one direction or another.
That’s why Tradeweb developed its innovative directional liquidity score that measures bid-side and ask-side liquidity independently. Built by our data science team – leveraging proprietary data and market expertise and initially launched in 2020 – it is available both on the Tradeweb platform and LSEG’s Workspace Excel, as well as via DataScope Select – LSEG’s feeds solution where these scores are delivered for enterprise use. In addition, the scores can also be retrieved on a single security basis from the All Quotes (ALLQ) app on Workspace.
The breakthrough directional liquidity score ranks European and emerging markets credit, including covered and SSA, instruments on a scale from 1 to 10 on both bid and ask sides of the trade, independently, with 1 representing the least liquid and 10 representing the most liquid instruments. It also provides a blended score, which highlights those instruments that could easily be bought and sold on the same day.
Buyer Beware
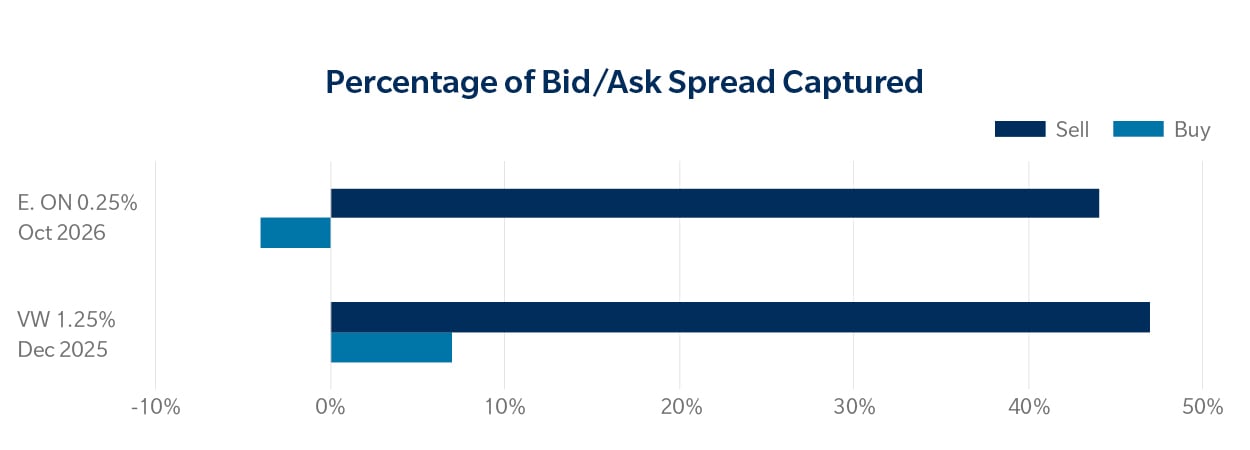
This additional layer of precision can mean the difference between best execution and sitting on a trade for days because the market is all one-way. For an example of how that can play out in the real world, take the 0.25% Oct 2026 bond for E.ON Group[1], a European energy network and energy infrastructure company. On March 1, 2023, our model assigned the bond a blended liquidity score of 3, which would suggest a relatively low level of overall liquidity, for this particular bond. However, beneath that blended score, the bid liquidity was a 9, while the ask liquidity was a 2. Thus, although overall liquidity was low, it should have been relatively easy to sell the bond[2], while achieving high execution quality.
In fact, we can see on the Tradeweb platform that there were several buys and sells that printed on the platform that day for this E.ON bond. The mean execution as a percentage of bid/ask spread[3] for sellers was 44%[4], which means that trades were executed, on average, largely near composite mid. However, the mean execution performance for buyers was -4%[5], which means that trades, on average were executed slightly worse than the composite ask.
A similar phenomenon occurred on June 12, 2023, when the 1.25% Dec 2025 bond for Volkswagen Group[6] had a blended liquidity score of 7, suggesting a highly liquid bond. However, while the bid liquidity was also scored at 7, the ask liquidity score was 3. Based on trading activity on Tradeweb, sellers of this VW bond on the day executed on average at 47%[7] of bid/ask spread, while buyers executed at 7%[8]. While the VW bond did, in fact, prove to be more liquid than the E.ON bond, as indicated by the higher blended liquidity score and seen with the higher average execution quality on both sides, buyers and sellers still experienced very different implicit costs when it came to real-world trading.
Select Bond Performance on the Tradeweb Platform
A Nuanced Approach to Liquidity Scoring
On those days, for those bonds, execution performance was hugely dependent on which side of the trade market participants found themselves. With directional liquidity scoring, clients see the full picture based on the direction in which they are trading. Without it, they only have a generic idea of liquidity, without the granularity needed to see how current market conditions might affect their specific needs.
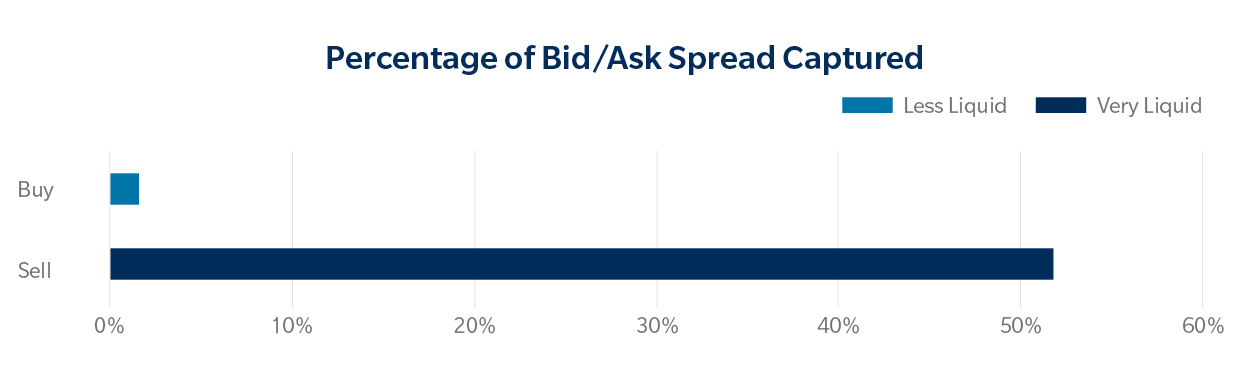
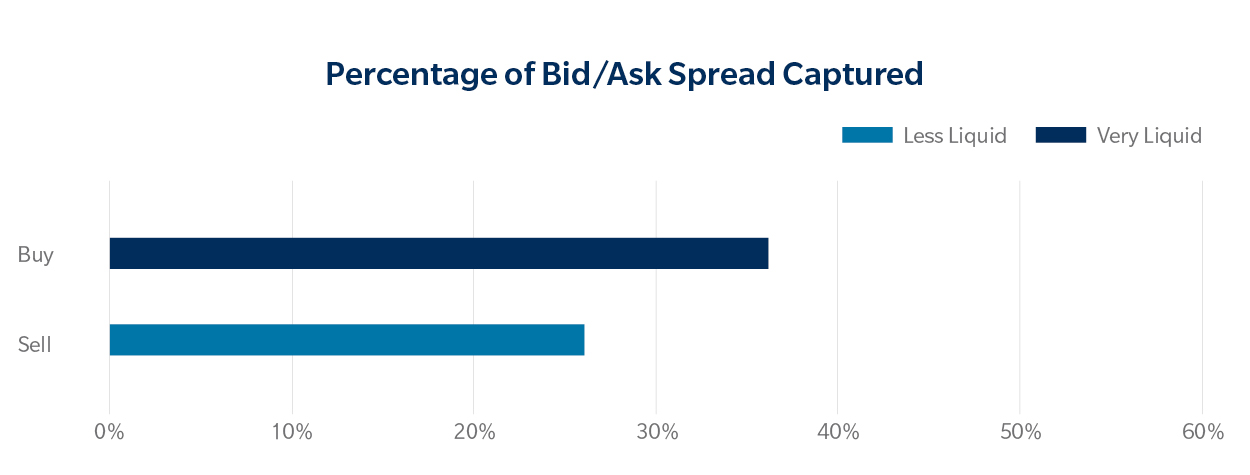
These two examples are not unique. In fact, when we look back at trading activity across European credit through the first half of 2023, we find that a total of 5,575 bonds traded where one side of our directional scores identified the bond as very liquid[9] while the other side was less liquid[10]. We tracked all of these trades and their subsequent execution levels and found that bonds with very liquid bid-side liquidity scores and less liquid ask-side scores on average executed better than mid when clients were selling and near ask when clients were buying. Meanwhile, bonds that were very liquid on the ask-side, while being less liquid on the bid-side, on average saw better execution for buys versus sells, as expected, although the difference between the two sides was much smaller.
Bonds with High Bid Liquidity and Low Ask Liquidity Performance
Bonds with Low Bid Liquidity and High Ask Liquidity Performance
Why it matters
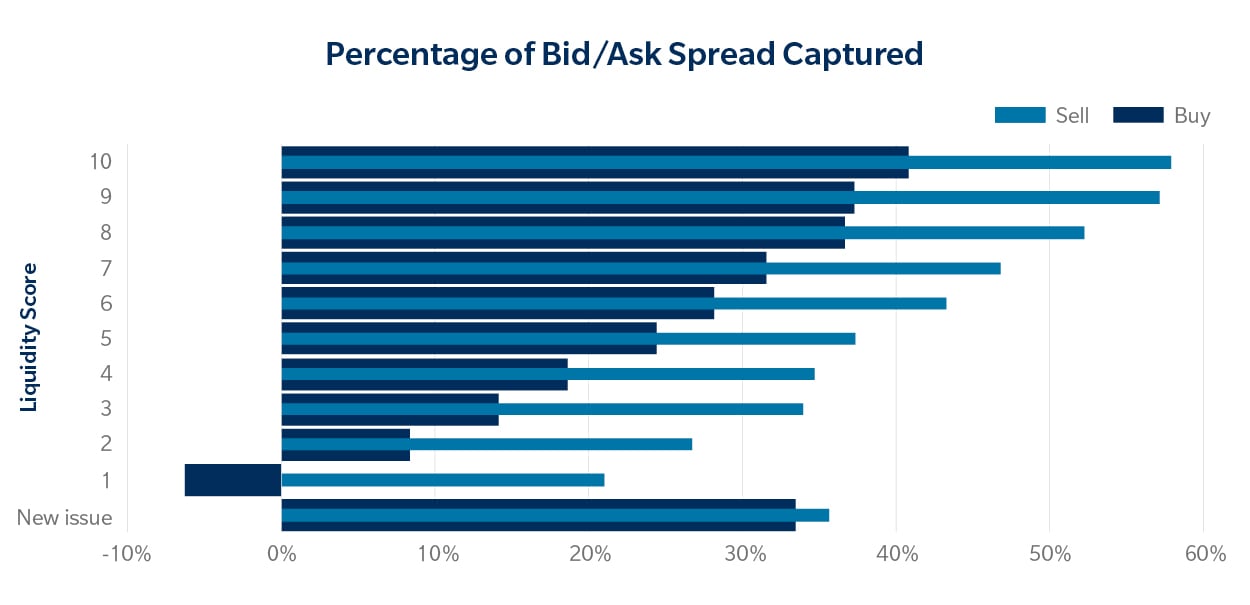
This degree of detail in understanding directional liquidity is particularly valuable in bonds that are not traded often or in emerging markets for which there may not be a long track record of market performance or meaningful market activity. Unlike single, direction-agnostic scores that give a general sense of overall liquidity, Tradeweb’s directional liquidity scores provide a situational perspective on what traders should expect, based on which side of the trade they represent. And we can see this when looking at the relationship between directional liquidity scores and average trade executions in European credit across all clients in the first half of 2023.[11]
Overall Bond Performance by Liquidity Score and Direction
As Tradeweb’s directional liquidity score evolves and develops, we look forward to working closely with our clients on developing solutions that encourage more transparent and efficient European credit and emerging markets. In the coming months, Tradeweb plans to expand on this offering through the introduction of new functionalities aimed at streamlining clients’ pre- and post-trade strategies even further. From an LSEG perspective, plans are also underway to include these scores in other apps within Workspace, such as Comparable Bonds (CMPB).
About our authors:
Jonathan Rick is a Director at Tradeweb, responsible for data product management including Tradeweb’s transaction cost analysis (TCA) and liquidity solutions. In this role, Jonathan leverages his experience in fixed income markets, understanding of market structure and background in machine learning to develop analytic products for clients. Prior to his current role, he was Director of Research, helping lead several data and analytic initiatives at the firm.
Emil Parmar is Director, Credit Trading Solutions, part of the Fixed Income Trading management team based in New York.
Emil joined LSEG in 2022 from Credit Suisse, where he managed U.S. Electronic Trading, Sales and Market Structure Strategy. Prior to this, he was responsible for Institutional e-trading products at Fenics (division of BGC Group), where he started as an emerging markets sales/trader in London covering real money and hedge fund clients.
[1] XS2069380991. Issued by E ON SE.
[2] Trader buys vs the ask and sells vs the bid
[3] Percentage of bid/ask spread is calculated as: If BUY, (Composite Ask – Price)/(Composite Ask – Composite Bid) or if SELL, (Price – Composite Bid)/(Composite Ask – Composite Bid). A value of 0% would mean that the client traded at the composite; a value of 50% would mean that the bond traded at the mid; a value of 100% would mean that the client bought (sold) at the bid (ask).
[4] Median was 46%. All stats are trade-weighted.
[5] Median was 0%.
[6] XS1734548644. Issued by Volkswagen Bank GmbH.
[7] Median was 48%.
[8] Median was 17%.
[9] A sided liquidity score of 7 or higher.
[10] A sided liquidity score of 3 or lower.
[11] Chart compares transaction cost as a percentage of bid/ask spread for standard settle, in-comp outright trades in European credit during Jan2023-Jun2023 with the ex-ante directional liquidity score at time of trade.