2014: Our Top Observations in the Global Fixed Income Markets
Welcome to our third annual review of the top themes in the global fixed income markets. 2014 saw a wide range of economic, political and regulatory events, from the divergence in central bank policies to the continued growth of the exchange-traded funds industry. As a leading fixed income and derivatives electronic marketplace, we were in a unique position to observe the key developments in 2014 that shaped the markets in anticipation of the New Year.
SEF Trading Comes of Age
Following the launch of swap execution facilities (SEFs) in late 2013, the derivatives trading industry saw the gradual implementation of new reform by the U.S. Commodities Futures Trading Commission (CFTC) with trading of certain swaps being designated as Made Available to Trade (MAT) on SEFs in February. The CFTC then mandated that package transactions begin trading on SEFs in March, leading to extraordinary growth in electronic trading volume over the following months. During that time, market share for e-trading of U.S. dollar interest rate swaps (IRS) increased from less than 10% of overall volume prior to reform, to about 50% of all IRS trades. However, the CFTC provided additional no-action relief from the SEF trading mandate for the next wave of package trades until early 2015.
The transition to SEF trading also introduced new innovation for electronic derivatives trading, including sponsored access to SEFs through an introducing agent, and compression trading for quickly netting or terminating trades at their derivatives clearing organization. Year to date, more than $690 billion in notional volume has been traded on TW SEF via compression. New Market Agreed Coupon (MAC) swaps also became a required transaction in February, and experienced strong growth in volume with more than $200 billion being traded on Tradeweb in 2014.
Regulation in Europe and Asia is Taking Shape
Many of the details around trading regulations outside of the U.S. are still being determined, leading to uncertainty as to what the impact will be in practice. In Europe, reporting obligations for over-the-counter (OTC) and exchange-traded derivatives under the European Market Infrastructure Regulation (EMIR) started on February 12. The rules relating to the mandatory clearing of certain derivatives under EMIR are expected to be finalized in 2015.
The European Securities and Markets Authority (ESMA) has proposed that the clearing obligation will be phased in by type of counterparty over time. Mandatory clearing of IRS is likely to start in the fourth quarter of 2015 for Category 1 market participants (clearing members), with clearing for the first category of members to begin in the second quarter of 2016. The clearing obligation for credit default swaps (CDS) is expected to start shortly after.
ESMA is also in the process of consulting on draft detailed rules under the Markets in Financial Instruments Directive (MiFID II) and Regulation (MiFIR), which jointly replace and significantly expand the current MiFID legislation. The new legislation was politically agreed early in 2014, but the complete set of rules will not apply until January 3, 2017. MiFID II and MiFIR incorporate the trading of standardized OTC derivatives as required by the G20 commitments, but also cover a broader range of instruments, such as fixed income securities and exchange-trade funds (ETFs).
In the Asia Pacific region, regulators began offering more clarity on derivatives regulation. Australia made progress in developing its proposals, while Japan’s Financial Services Agency (FSA) continued to engage with market participants toward defining the scope of reform. The first electronically-traded and JSCC-cleared yen swap transaction by a Japanese bank was executed on Tradeweb in June, highlighting that Japanese firms are preparing for implementation of local derivatives trading rules, published in July.
The Path to Economic Recovery Becomes Less Clear
The second half of 2013 set the scene for a long-awaited turning point in the course of global economic recovery. It was followed by stronger economic data, raised growth forecasts and credit rating upgrades at the start of the new year. The World Bank predicted more robust growth for 2014, while the International Monetary Fund raised its global growth outlook to 3.7% and upgraded forecasts for the U.S., UK and the eurozone. Europe’s peripheral economies were among the primary beneficiaries of buoyed investor sentiment in the fixed income markets.
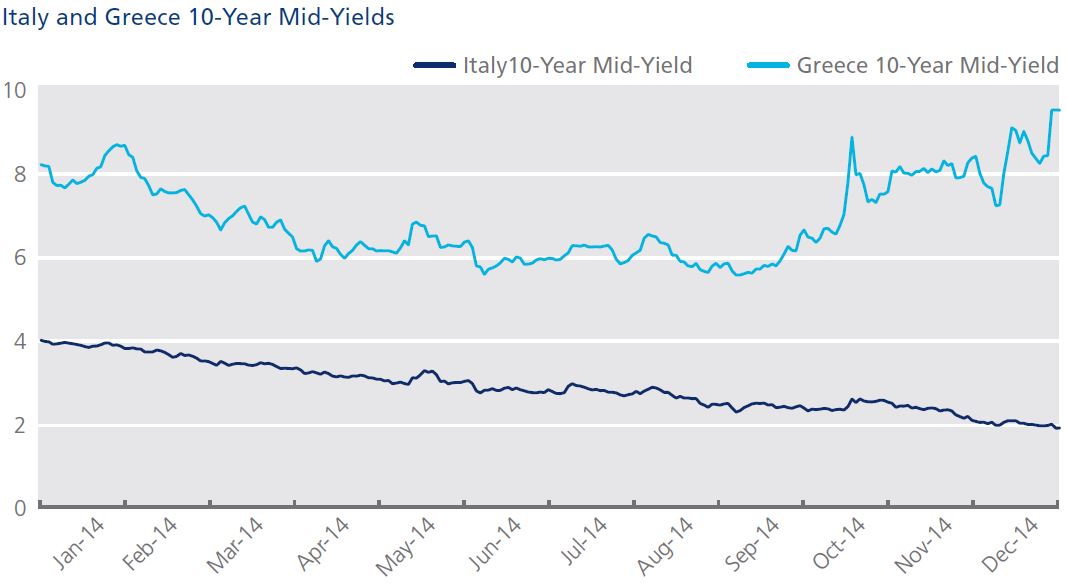
Borrowing costs for peripheral governments continued a downward trajectory, dropping below pre-crisis levels in most cases. Greece returned to the financial markets after a four-year absence, issuing a 5-year government bond in April. A month later, Portugal became the second eurozone state after Ireland to exit its bailout program without a precautionary credit line.
However, rising geopolitical tensions and softer economic data, particularly in the latter part of 2014, increased investor concerns over the sustainability of economic recovery amid deflationary pressures in certain regions of the globe. Japan’s economy shrank in the second and third quarters, and Germany cut its 2014 and 2015 growth forecasts in October.
Furthermore, Italy found itself back in recession after its economy contracted in the first three quarters of the year. After Greece’s 10-year government bond yield dropped to its lowest level (5.51%) since December 2009 on September 5, fears over the country’s political and financial stability re-emerged, sending yields back up to 9.43% on December 30.
The U.S. though seems to be on an upward path still: in December, its third-quarter GDP growth was revised up to 5% on an annualized basis.
Central Banks Adjust Monetary Policy
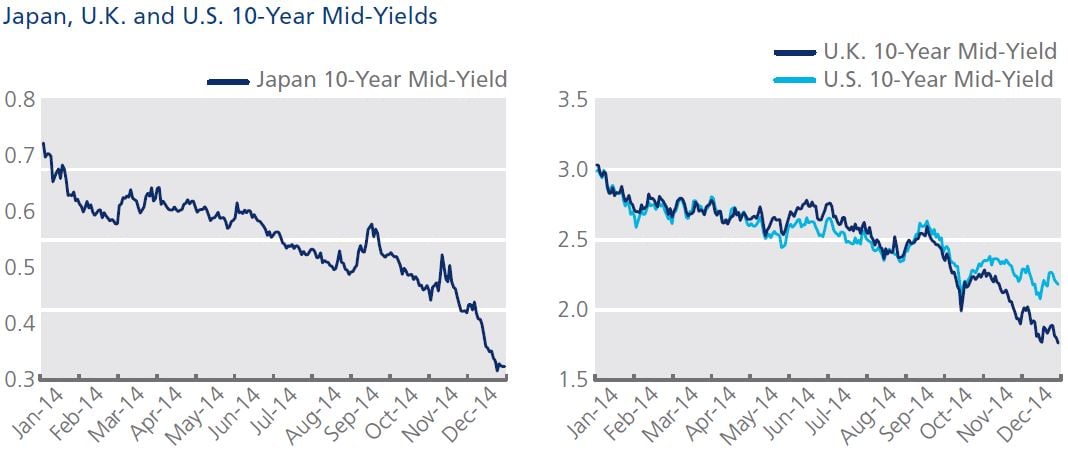
Central bank monetary policy diverged further in 2014, reflecting an uneven pace of economic recovery across different countries and regions. The U.S. Federal Reserve ended its third round of quantitative easing (QE3) in October, but kept interest rates low. In the bond market, 2014 began with the bid yield on the U.S. 10-year Treasury note hitting a year-high of 3.03% on January 2. On October 15, 10-year note yields saw their biggest one-day decline since 2009, briefly falling to 1.86%, the lowest intraday bid yield since May 2013. After closing at a low of 2.07% on December 16, the 10-year ended the year at 2.17%, more than 125 basis points lower than many economists predicted at the beginning of 2014.
In contrast, the Bank of Japan (BoJ) voted to boost its target amount of annual asset purchases from between ¥60 and ¥70 trillion to ¥80 trillion at its October 31 meeting. The BoJ also said it would buy longer-dated debt, and triple its purchases of ETFs and real estate investment trusts (REITs). The country’s benchmark 10-year bond began the year at a high with a mid-yield of 0.72% on January 6; however, it subsequently declined to a low of 0.31% on December 25.
The Bank of England (BoE) updated its “forward guidance” policy in February, which previously tied a potential interest rate rise to an unemployment rate of below 7%. The BoE left interest rates and Gilt purchases unchanged, as UK inflation fell to a 12-year low of 1% in November. Mid-yields for 10-year Gilts reached a 2014 high of 3.03% on January 2 and trended downward to reach a year low of 1.75% on December 31.
Meanwhile, deflationary fears prompted the European Central Bank to adopt a set of measures to help protect the eurozone’s fragile recovery. These included deeper interest rate cuts, a package of cheap loans for banks to improve lending to the non-financial private sector, and purchases of asset-backed securities and covered bonds.
Oil Prices and Geopolitical Tensions
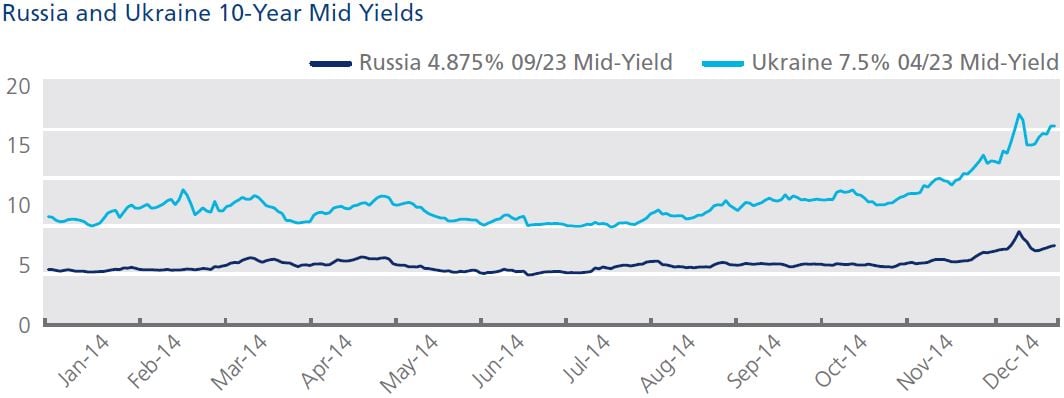
In its latest assessment of global financial risks, the BoE warned that the decline in oil prices could heighten geopolitical tensions, trigger defaults by U.S. shale oil and gas firms, and destabilize eurozone inflation expectations. There has already been evidence of this in 2014: Russia’s central bank raised its interest rate from 10.5% to 17% to combat the depreciation of the national currency and stave off deflation, on the same day the BoE’s Financial Stability Report was published. Russia’s economy has been affected by international sanctions over the country’s escalating tensions with Ukraine, as well as plunging oil prices. The yield on Russia’s U.S. dollar-denominated bond maturing in September 2023 spiked to 7.79% on December 16, its highest level in the year. Ukrainian bond yields also suffered in 2014 as the yield on the country’s 04/23 dollar-denominated bond climbed to a year-high of 17.58%, also on December 16. Fears that the country may need to restructure its debts have been gradually increasing.
Two-year Government Bond Yields Turn Negative (again)
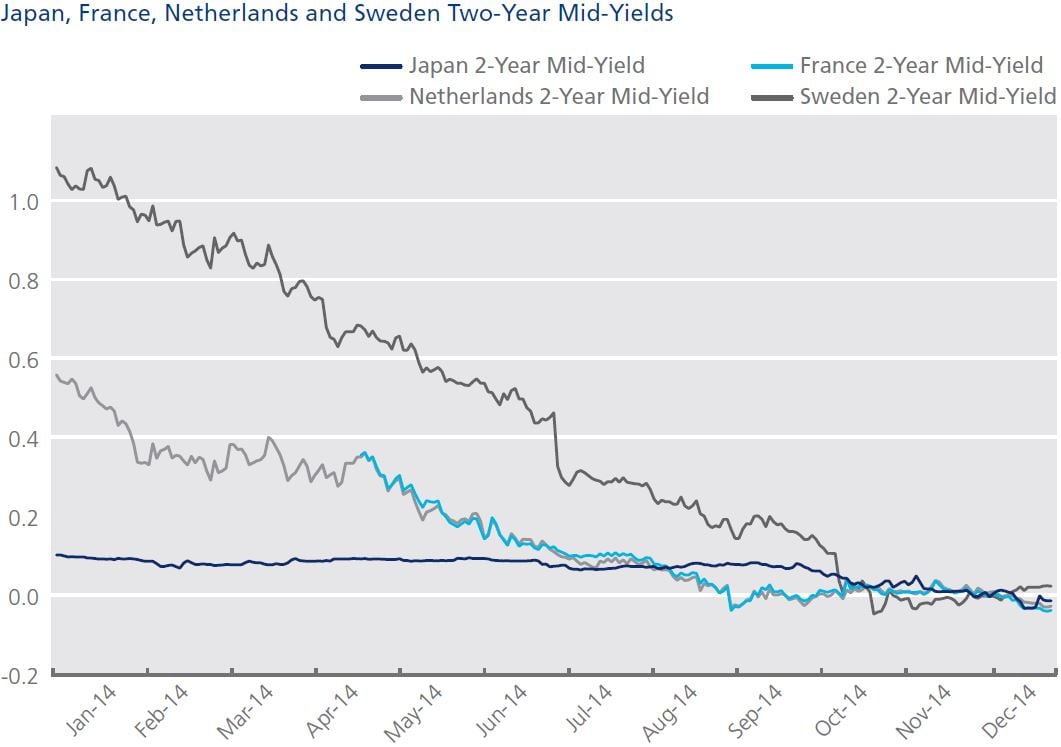
The yield on two-year Japanese government debt turned negative for the first time ever on November 28, continuing a trend also seen in some of Europe’s largest economies in a year of record low interest rates, heightened geopolitical risks and disappointing economic data. Two-year government bond mid-yields for Austria, Belgium, Denmark, Finland, France, Sweden and the Netherlands have been dipping below 0% intermittently since September, while German two-year bond mid-yields first closed in negative territory in August. According to the Bundesbank, the German Finance Agency sold €3.341 billion of a two-year note at a record low average yield of -0.07% in September, the first time German two-year debt was sold at a negative yield since 2012.
A Changing Municipal Bond Market
Municipal bonds experienced strong performance in 2014, following a year that saw major redemptions of nearly $50 billion as news spread of Puerto Rico’s debt issues and Detroit’s Chapter 9 bankruptcy. Though Puerto Rico’s bond rating was downgraded by Moody’s to B2 in July, after downgrades by all three ratings agencies to junk in February, the municipal bond market had some positive news when Detroit emerged from bankruptcy on December 11. This led to the longest rally in state and local government debt since 1992, according to Barclays, posting gains for 10 consecutive months. Based on data from Lipper, which tracks fund flows, muni bond funds have seen $18.2 billion in investments through October. Data compiled by the Wall Street Journal also shows that municipal bonds returned 8.32% through the beginning of November, higher than the Dow Jones Industrial Average (6.86%), investment grade corporate debt (6.68%) and U.S. Treasury debt (4.07%).
As the market prepares for 2015, reform of municipal bond trading is on the horizon. Under consideration is the provision to provide investors who purchase less than $100,000 in municipal bonds more information on what their securities firm paid for them under new mandates proposed by the Municipal Securities Board (MSRB). These would require brokers to disclose the prices they pay for bond issues on their trade confirmations, and are the latest effort by regulators to increase transparency in the $3.7 trillion municipal bond market.
Record Assets for ETFs/ETPs in Europe
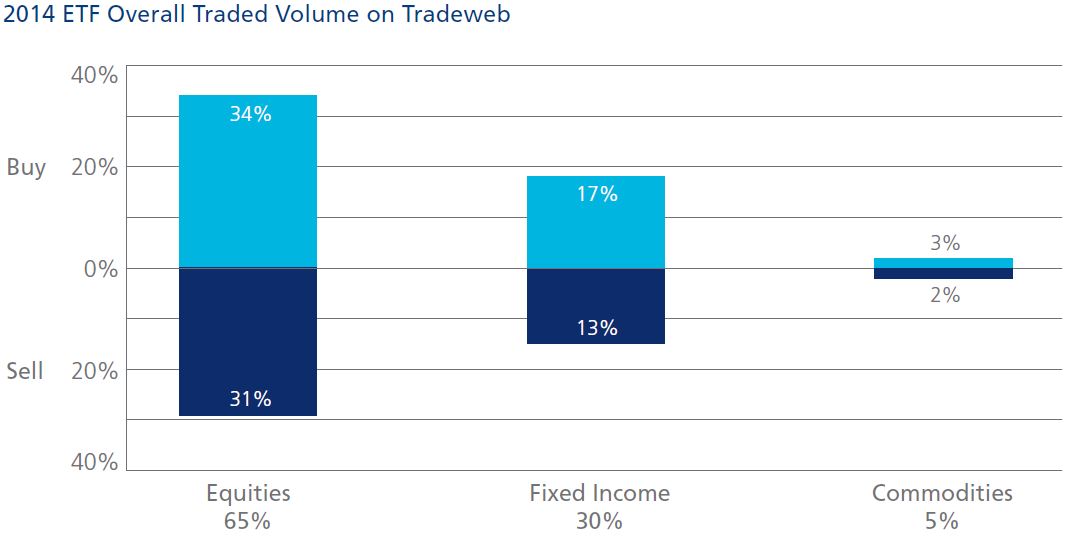
Net new assets for European ETFs and exchange-traded products (ETPs) reached $61.8 billion in 2014, according to ETFGI, beating last year’s record. Total assets grew to $477.4 billion at the end of August, but have since dropped slightly to $472.1 billion. According to BlackRock’s Global ETP Landscape Report, ETPs in Europe enjoyed a successful year, as market penetration improved and ECB bond purchases boosted fixed income flows.
On the Tradeweb European-listed ETF marketplace, overall traded volume increased almost threefold in 2014, compared to the previous year. Trading activity in fixed income ETFs rose by three percentage points to 30%, while equity and commodity ETF trading saw a decrease of two and one percentage points, respectively. ”Buys” surpassed “sells” across all asset classes, reversing last year’s selling trend in fixed income and commodities ETFs.
Debate Heats Up on Corporate Bond Liquidity
New U.S. corporate debt issuance surpassed $1.5 trillion in 2014, while globally the number topped $4 trillion by the end of November with major bond issues from Medtronic, Apple, Alibaba and Volkswagen, among others. However, in order to meet capital requirements and regulations, Wall Street banks significantly reduced their corporate bond inventories during the year.
The debate about corporate bond liquidity continued to dominate headlines in 2014, and more market participants joined the conversation on the lack of corporate bond liquidity. Currently, only about 15% of U.S. corporate bond trades are executed electronically, while the rest are traded over the phone, according to TABB Group. The disparity led to the introduction of several new corporate bond trading platforms, including the Tradeweb investment grade corporate bond trading platform, which leverages new streaming price and RFQ protocols to support the 85% of the market that does not trade corporate bonds electronically.
The absence of corporate bond liquidity was also hotly debated in Europe. According to RBS, a European corporate bond issue trades once a day on average, compared with almost five times a day a decade ago. Electronic trading in cash credit products is estimated around 35% of the overall market volume. The portion of the market traded electronically is focused on the more liquid bonds and in trade sizes up to €10m, however, liquidity concerns center upon illiquid bonds and large block trades. On the Tradeweb European cash credit platform, the asset manager “hit-rate” – the percentage of price requests resulting in trades – has continued to grow steadily to 84%.
ECB Stress Tests and the Recapitalization of Eurozone Banks
Eurozone finance ministers adopted a new instrument under the European Stability Mechanism (ESM) in December, allowing for direct capitalization of troubled banks in the region. Previously, the ESM could only provide assistance to banks indirectly, via the government of the euro area member state where they are incorporated. The new direct recapitalization instrument removes the link between governments and banks, which is regarded as a potential destabilizing factor for some eurozone countries that could affect market sentiment.
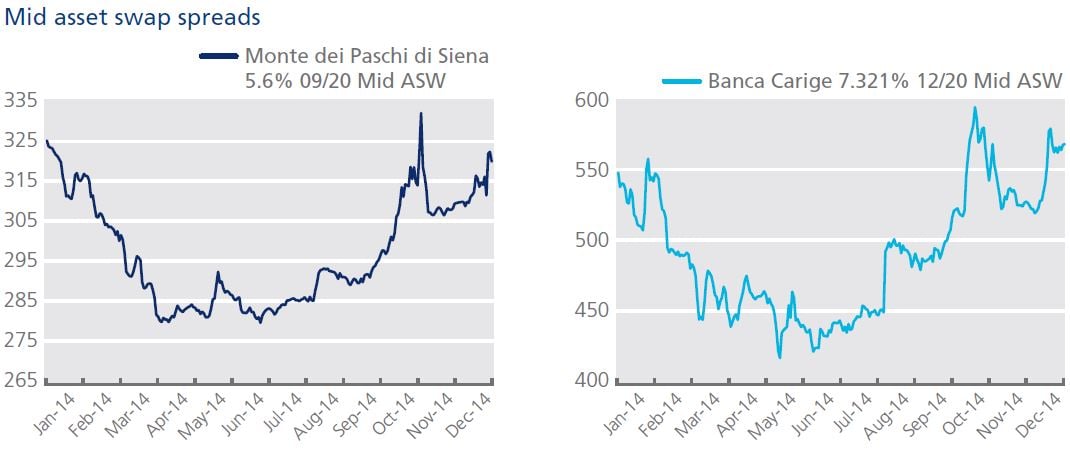
Earlier in the year, the European Banking Authority’s (EBA) 2014 stress test results, released on October 26, identified 25 banks with a capital shortfall of €25 billion. The stress test assessed the resilience of 123 banking groups across the EU against adverse economic developments, in order to understand systemic risk in the region, foster market discipline, and increase confidence in the banking sector. Of the 25 banks, 13 had to raise their levels of capital. Mid asset swap spreads for debt issued by Banca Carige and Monte dei Paschi di Siena, which were among these 13 banks, hit their widest levels for the year on October 16 and October 31 respectively.
European CDS Contracts under New ISDA Standard - Financial and Investment Grade Indices Converge
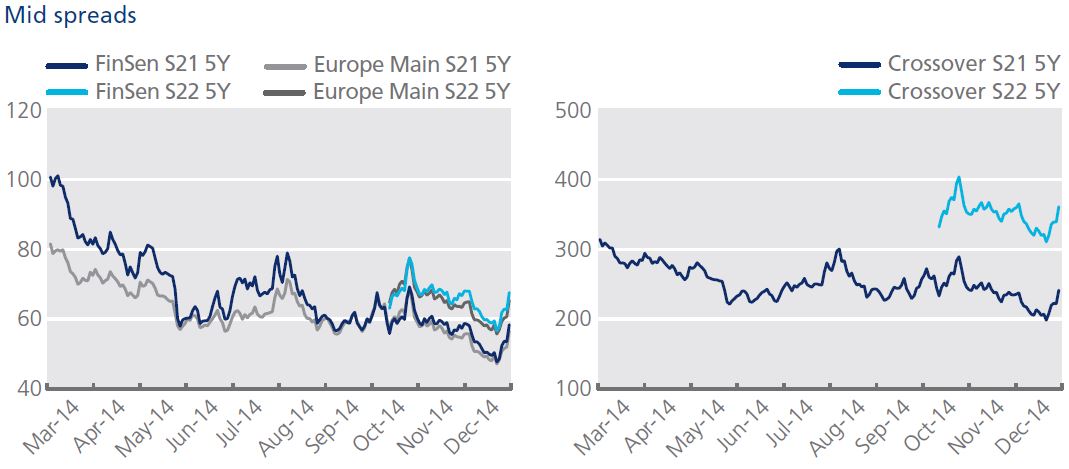
Since October 6, European credit indices have been trading under a new standard for CDS contracts, the 2014 ISDA Credit Derivatives Definitions. The implementation of the new rules coincided with the trading of the new series (22) for iTraxx indices, which saw fifteen new sub-investment grade companies being added to the Crossover. Both series 21 and 22 of the index traded at their tightest level on December 5, at 197 and 310 basis points respectively, but retraced back to 252 and 379 basis points on December 16, as concerns over falling oil prices, the political uncertainty in Greece and the state of the Russian economy deepened.
Earlier in the year, the iTraxx Europe index, which comprises 125 equally-weighted European investment grade companies, and the iTraxx Senior Financials index, a benchmark linked to European senior financial debt, converged intermittently throughout September and the first half of October.
Preview for 2015
Regulation
• Final Regulatory Technical Standards (RTS) on the clearing obligation for IRS under EMIR are expected to enter into force in Q2 2015
• Clearing obligation for IRS for category 1 market participants is estimated to start in Q4 2015
• ESMA consultation on draft RTS on key MiFID II/MiFIR markets provisions – consultation closes March 2, 2015
• ESMA to deliver draft RTS on key MiFID II/MiFIR markets provisions to the European Commission by mid-2015
• Electronic trading of yen swaps in Japan is mandated from September 1, 2015
Central bank monetary policy
• Divergence in central bank policy could gather pace
• The U.S. Federal Reserve likely to raise interest rates, in contrast with the ECB and BoE
• The ECB could implement additional stimulus measures, potentially including government bond purchases
European ETF market
• The European ETF/ETP industry should break through the $500 billion milestone in the first half of 2015 and fixed income ETFs will continue to grow in popularity
• Further harmonization in ETF infrastructure to address market fragmentation is on the way
• Post-trade reporting initiatives will increase ahead of MiFiD II
Corporate credit market
• The role of electronic trading will become increasingly important in the credit industry’s attempt to define new market structures
• Innovation will be key and new tools will be developed aimed at improving the current dealer-to-client ecosystems