Portfolio Trading Trends: A Breakdown of 2022

Ted Husveth
Managing Director, U.S. Credit, Tradeweb
2022 was a challenging year in credit markets. With large interest rate hikes and recessionary fears, corporate bond markets faced one of their toughest years since 2008. However, through the storm, clients continued to use Tradeweb as an avenue for finding liquidity, taking advantage of our suite of innovative trading protocols and tools. Fully electronic trading volume on our US platform was up 17% in 2022 compared to the year prior.
One protocol which continues to grow in popularity on Tradeweb is portfolio trading. Now a fairly mature and mainstream protocol in the marketplace, portfolio trading has continued to be a reliable execution method for clients looking to trade baskets of risk, with over $270 billion executed in 2022 on the US platform. In this piece we explore portfolio trading trends we saw in 2022, highlighting any similarities and differences compared to 2021.
Portfolio Trading Market Size
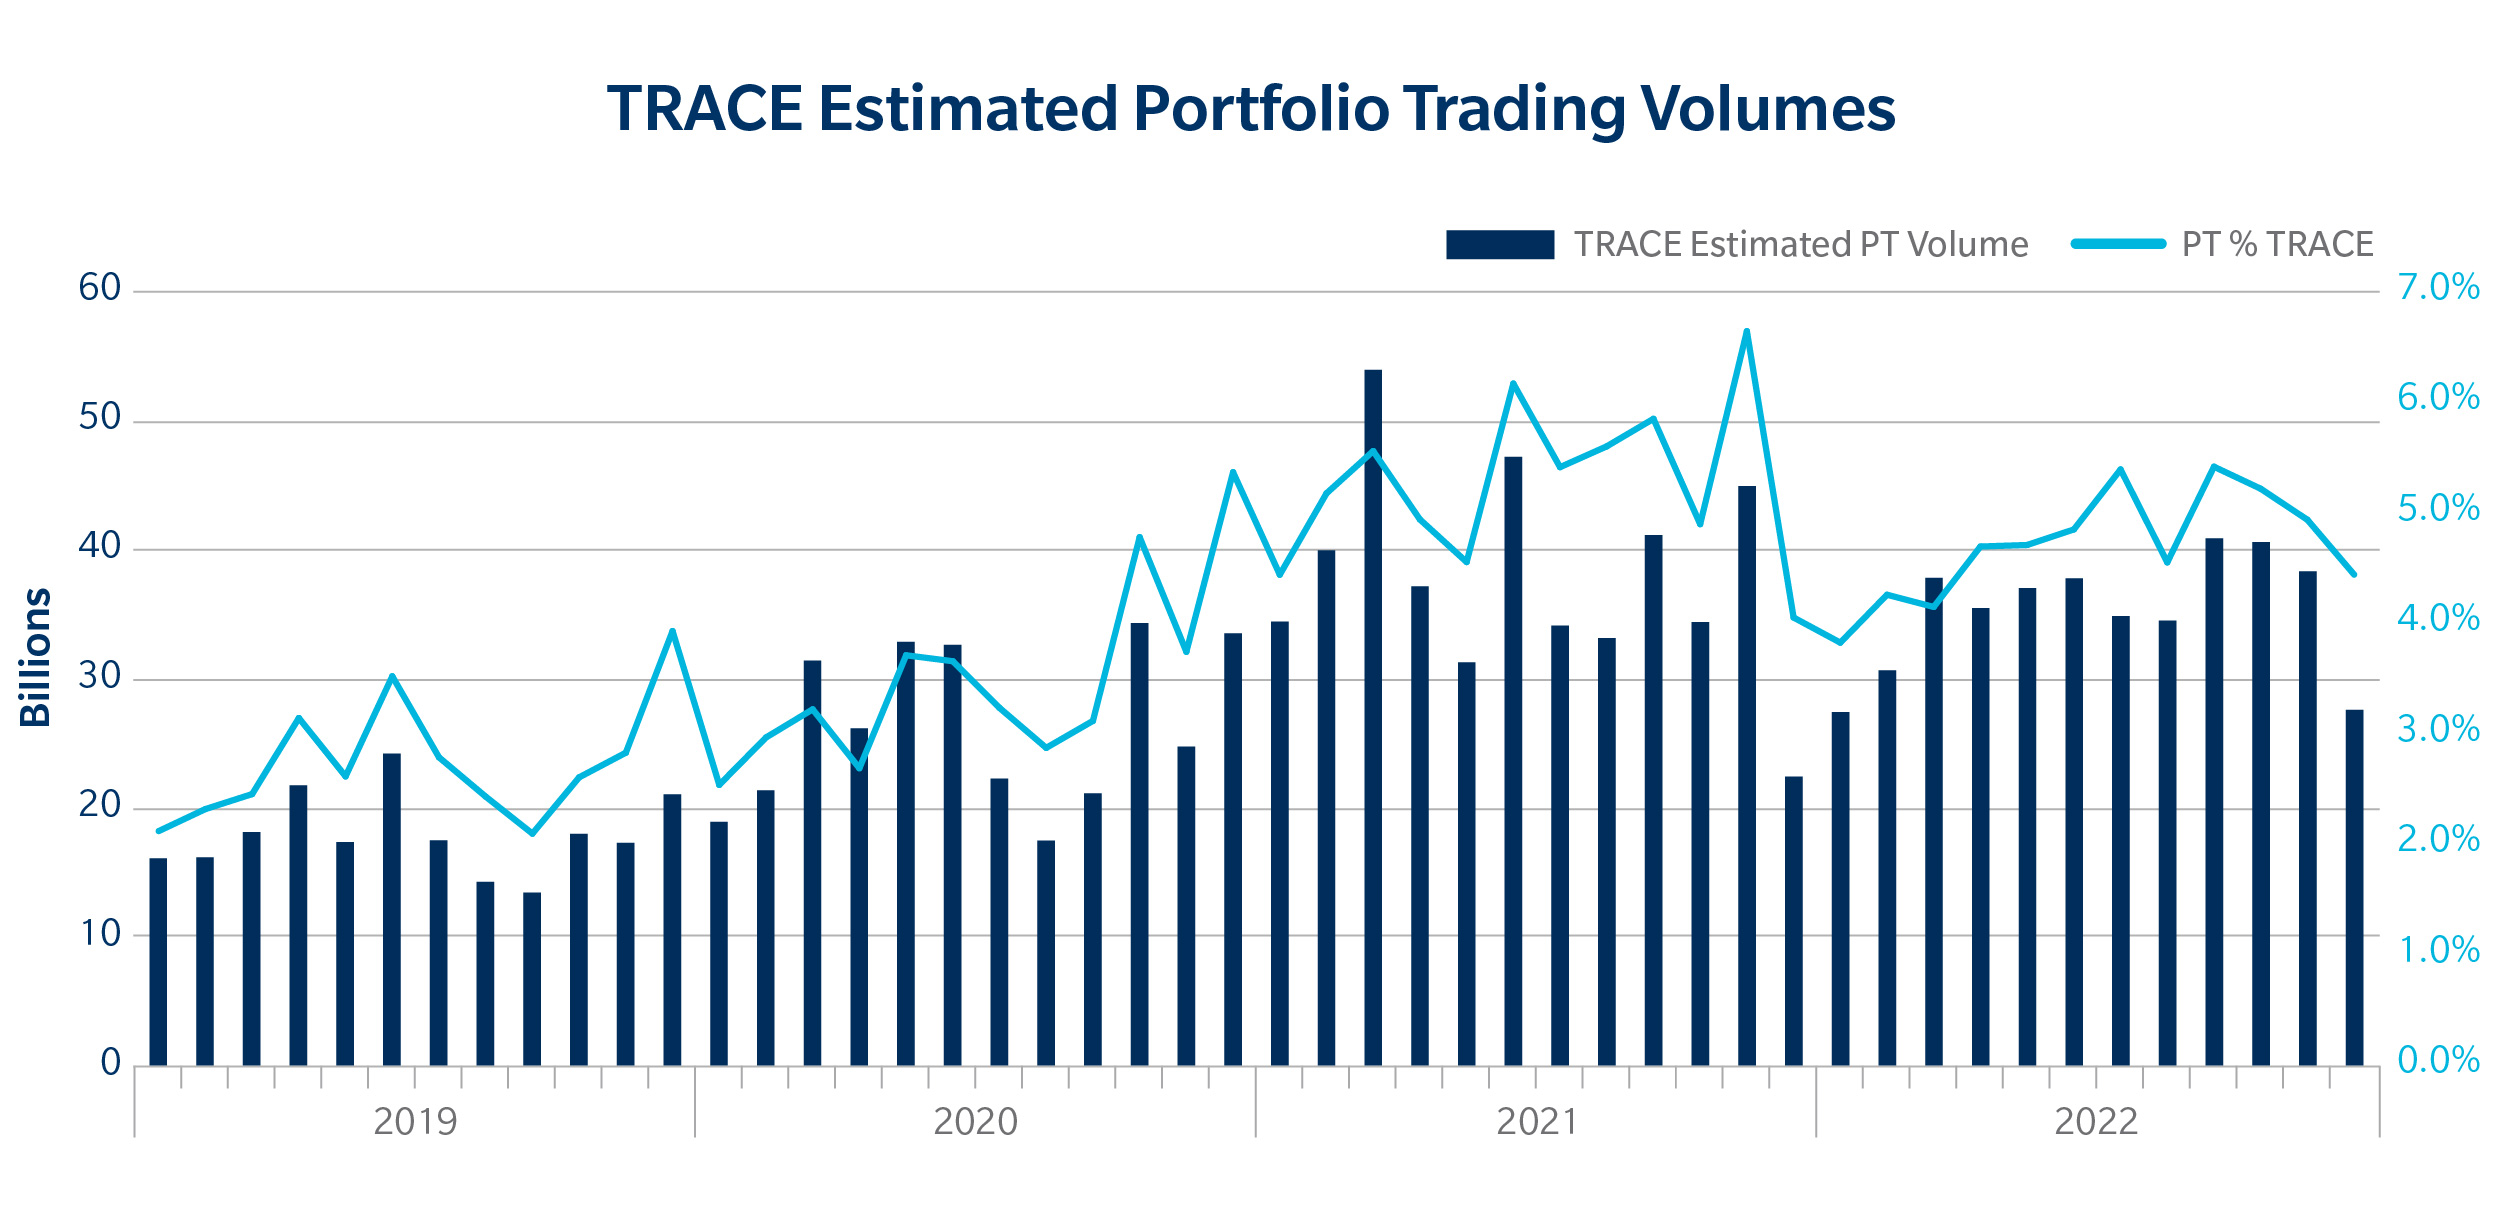
On Tradeweb’s U.S. Credit platform, clients continued to reap the benefits of the protocol in 2022, with portfolio trading volumes up 19% and the number of users up 30% year-over-year over 2021. Looking beyond Tradeweb, our estimates of portfolio trading volumes across credit markets reflect a steady share of around 5% of total TRACE.
Average Line Item Size
One emerging theme we saw in portfolio trading was that the number of items traded had increased significantly in 2022 as compared to 2021. For Tradeweb portfolio trades, the number of line items traded increased by 40% compared to 2021 – compared with total volume growth of 19%. This implies that the average size per line item has been decreasing over time, which could be a product of how clients are adapting their use of portfolio trading with increased volatility in the market. With levels moving more rapidly as compared to the year prior, clients could have been shying away from taking large positions in one basket trade, and instead chose to accumulate it in several trades throughout the day. The average line item size for Investment Grade (IG) and High Yield (HY) portfolio trades decreased 15% from around $690k to $590k in 2022 compared to 2021.
This is also a trend we have seen in general on TRACE, with trade counts increasing by 43% in 2022 as compared to 2021 and volumes only increasing by 5%. While this trend may be a result of changing market conditions, we also view this as a testament to the growth of electronic trading overall, as the credit market continues to embrace electronification, more bonds are trading across institutional, retail and wholesale markets.
Dealers in Competition
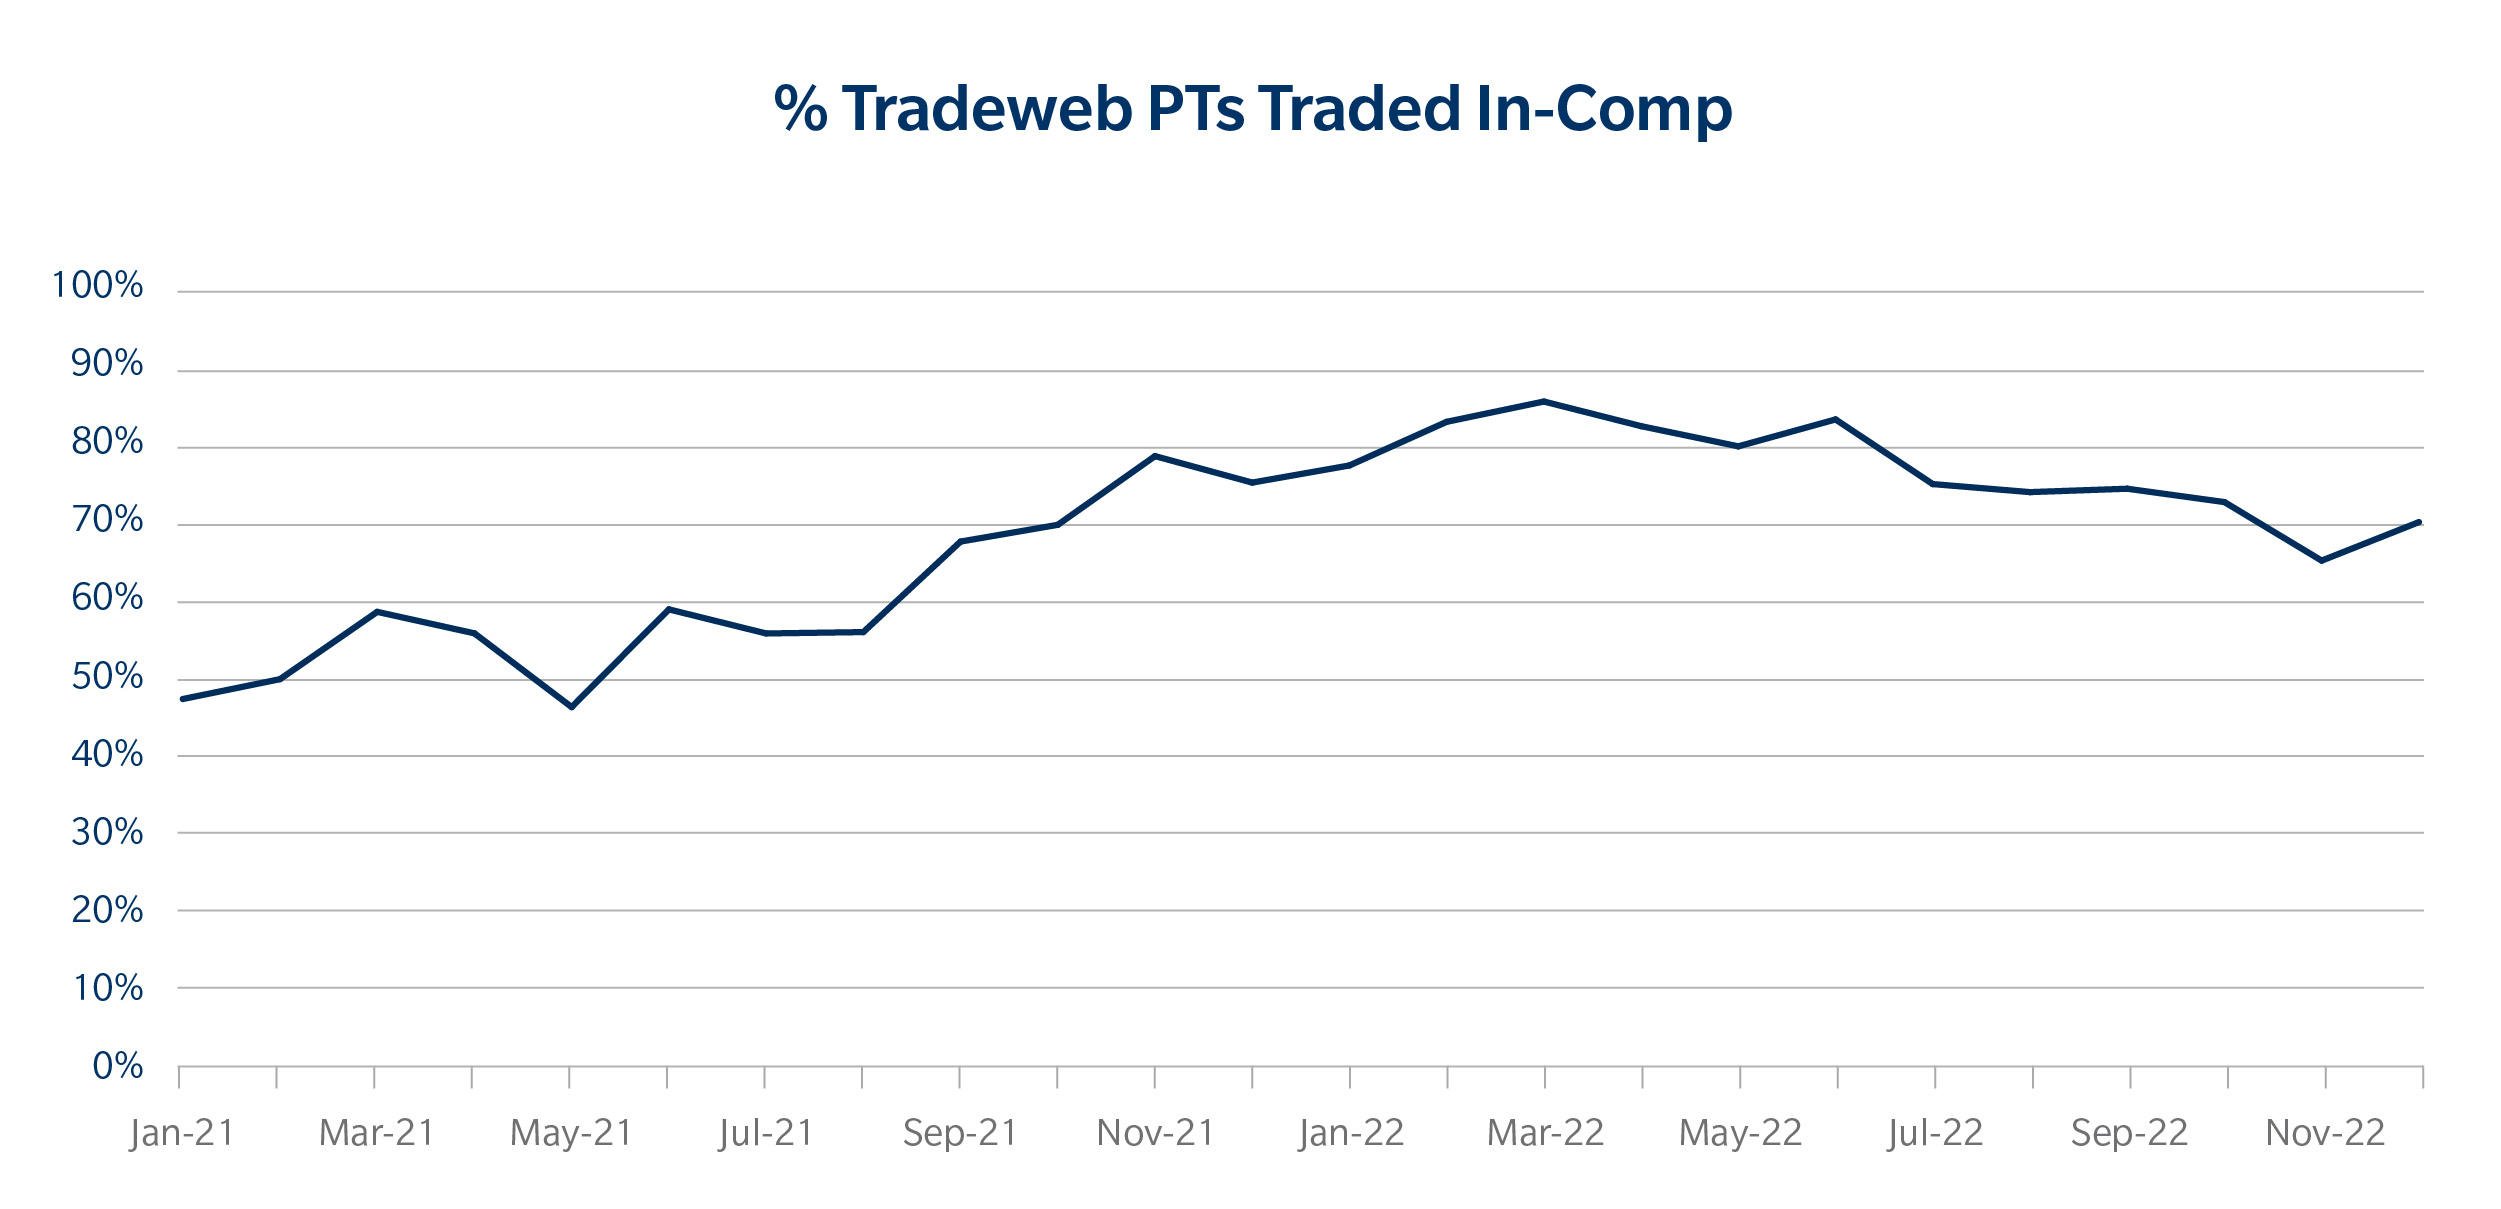
As portfolio trading becomes further entrenched in the marketplace, clients have become increasingly comfortable putting their portfolio out to more dealers in competition (in-comp). In response to this trend, in November 2021, Tradeweb enabled clients to send their portfolio trades to up to 8 dealers in-comp. This coincided with the broader theme of seeing a higher percentage of baskets being sent in-comp. Clients clearly see the benefits of having more dealers pricing the portfolio even if that means trading off some information leakage.
However, as the marketplace became more volatile throughout the year, we saw that the share of baskets trading in-comp slowly decreased from March 2022. This wasn’t all that surprising given the fact that information leakage becomes more important in times of market volatility—meaning clients typically feel more comfortable sending their basket to just the one dealer rather than showing their positions to the broader market. That being said, given a portfolio was put in-comp, the average number of dealers who saw the basket increased to 5.1 in 2022 as compared to 4.6 in 2021. We also saw this trend translate in terms of notional as well, with in-comp volume making up 77% of our portfolio trading volumes in 2022 as compared to 71% in 2021.
Execution Quality
As discussed in an earlier blog post, it is necessary to look at several metrics to measure execution quality in portfolio trading. Below is a breakdown of what we think are three central pillars of execution quality and what metrics we use to gauge them.
1. How often do I get my whole portfolio done?
To measure this, we can look at hit rates for portfolio – i.e. what percentage of the basket that clients send in ultimately gets traded. Hit rates being close to 100% for portfolio trades has been cited as a massive win for clients. Despite the higher volatility we’ve experienced in 2022, this certainty in execution has continued to be a major theme we’ve seen play out across our platform. In 2022, the overall hit rate for in-comp portfolio trades on Tradeweb was 91%, very similar to the 94% we saw in 2021. Below you can see this hit rate has remained relatively stable over time. 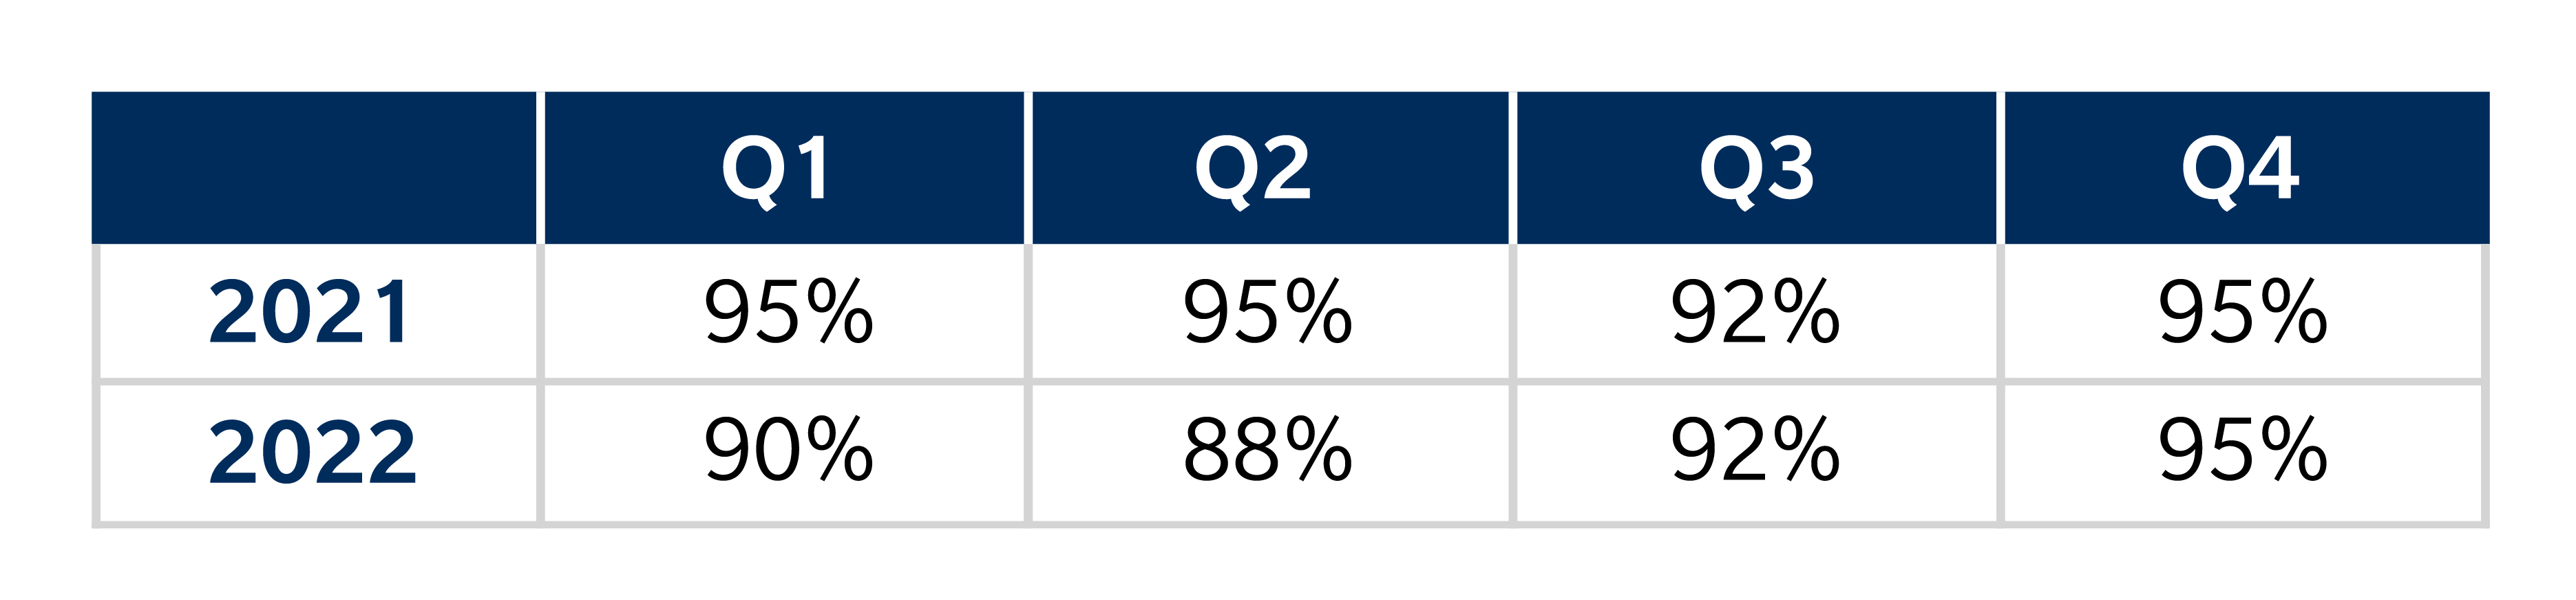
2. How quickly can I trade my portfolio?
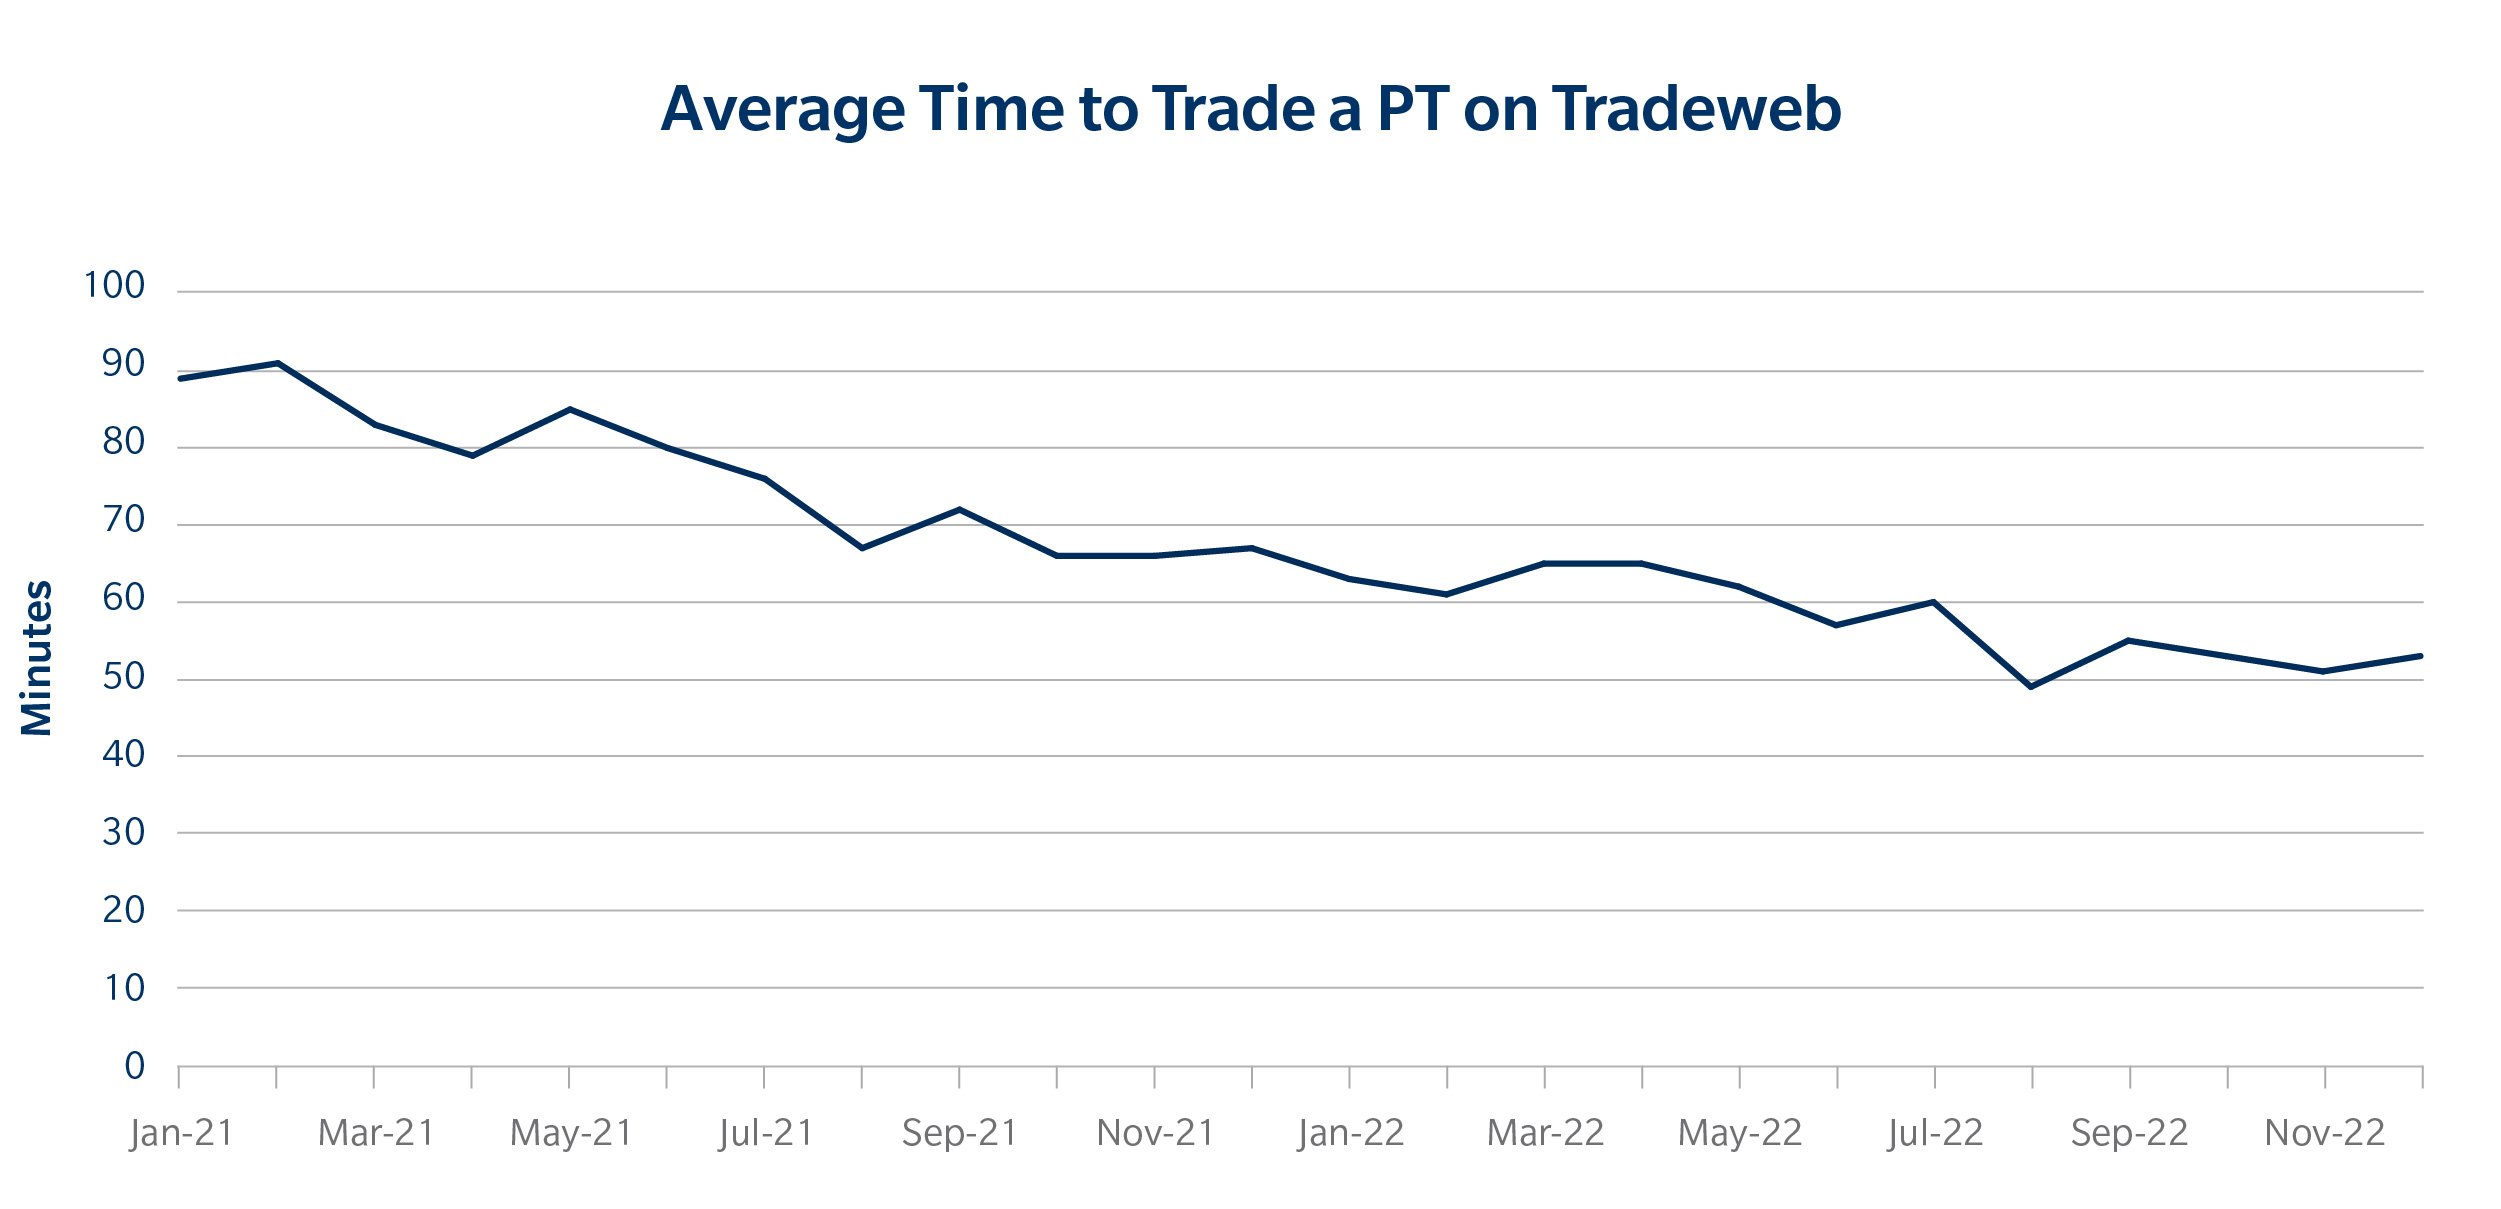
Given the high hit rates, it’s also important to measure how quickly a portfolio trade gets priced and traded. This becomes even more useful in choppy market conditions where levels may move around significantly from when the client actually sent the trade out to the market. In 2022, it was clear that portfolios were priced and traded faster in 2022 as compared to 2021, with the average time under 1 hour. This increase may have been due to the market conditions as well as the fact that pricing portfolios has become more streamlined and efficient as the protocol has matured and portfolio trading dealer desks have expanded.
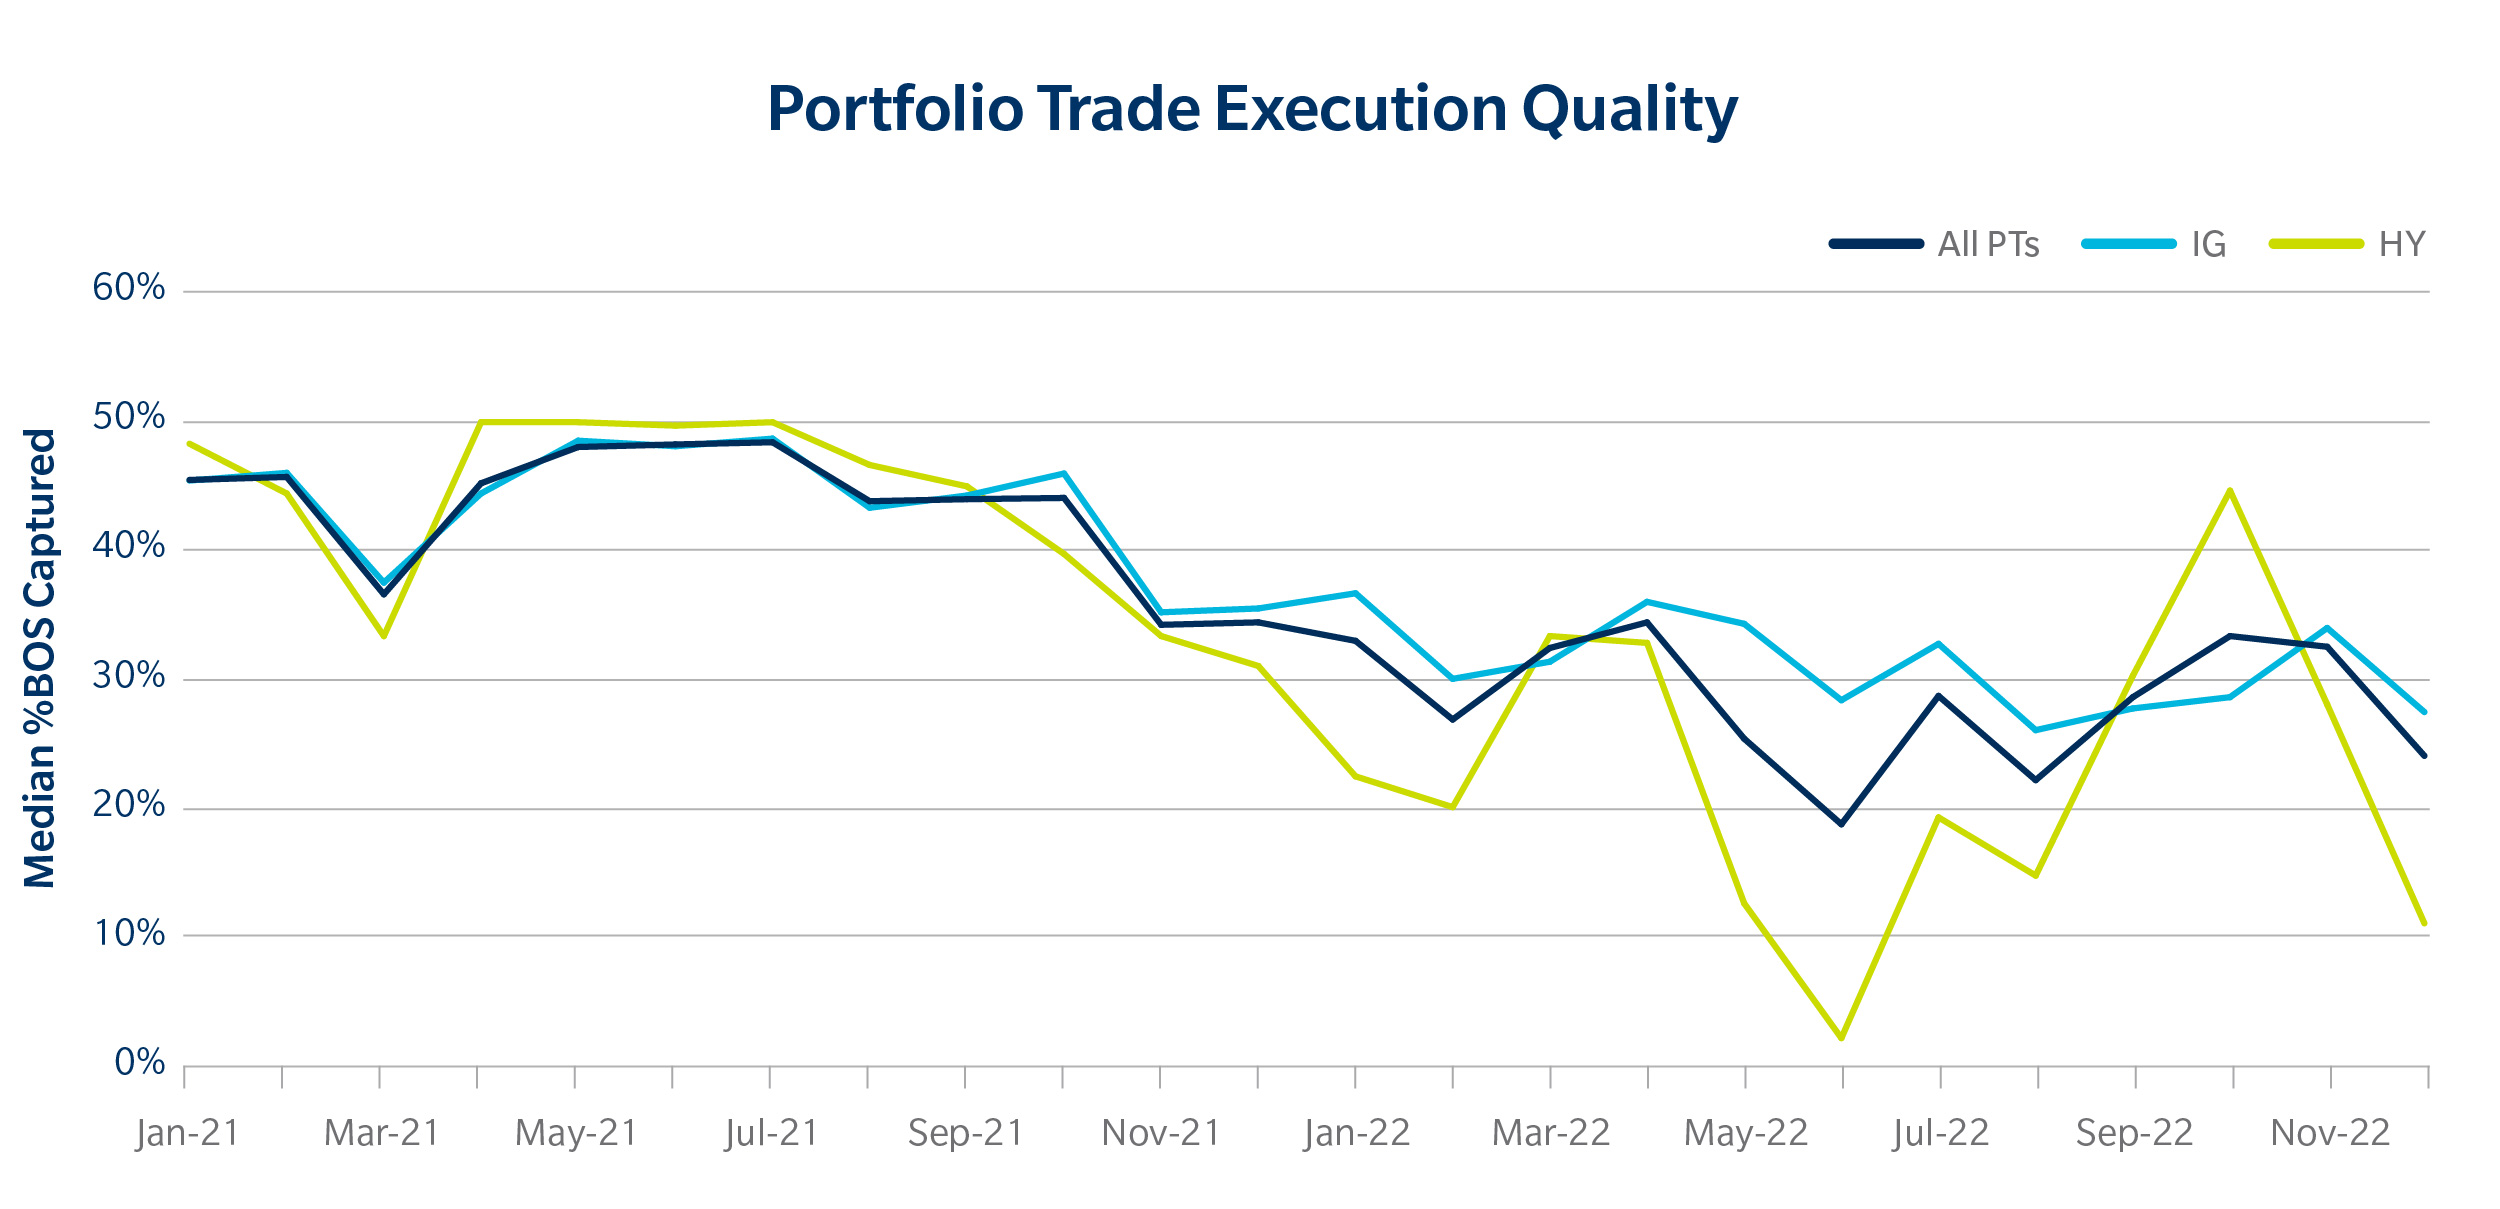
3. What is my cost to trade my portfolio?
As we would expect to see in sustained periods of volatility, cost to trade varies strongly. If we track the median percentage bid-offer spreads (BOS) captured vs Tradeweb’s Automated Intelligent Price (Ai-Price) tool, we can see that this measure has decreased slightly as market conditions have changed through 2022 compared to 2021, though staying well inside the Tradeweb Ai-Price bid/offer. This variation in cost was more prominent in HY across the year with large fluctuations throughout the year.
Overall, portfolio trading remained an attractive execution vehicle for clients in 2022, despite the challenging market conditions. The variations in cost are not dissimilar to what we saw in RFQ through 2022 – and there are still differential benefits of trading within an hour and with close to all or nothing execution.
2023 and Beyond
We foresee portfolio trading continuing to be a valuable protocol for our clients in 2023. In the past few years, portfolio trading has withstood a period of sustained volatility and demonstrated its benefits even in the toughest of markets.
In 2022, we introduced several enhancements – including the ability to Bulk Cross as well as significant improvements to our Trade-at-Close protocol. With adoption growing across key investor regions (EU and Asia for example) and markets (EU Credit and Emerging Markets are significant growth areas), we continue to add features and functionality that meet an increasingly diverse set of customer demands.
In May 2023, we are expecting the portfolio trading tag to be rolled out on TRACE. This means we will be able to more clearly identify portfolio trades and get a clearer sense of the size of the market. This will allow us to more accurately see trends across the market and we look forward to sharing any insights and translating them into enhancements on the platform.
Related Content