Measuring Execution Quality for Portfolio Trading

Ted Husveth
Managing Director, U.S. Credit, Tradeweb
In our last blog post, we detailed how we estimate market-wide portfolio trading volumes, and how those volumes have grown as a proportion of TRACE over time. It follows then that portfolio trading must be getting something right, and so the topic we’ll tackle today is execution quality, a theme that comes up time and again in conversations with our clients.
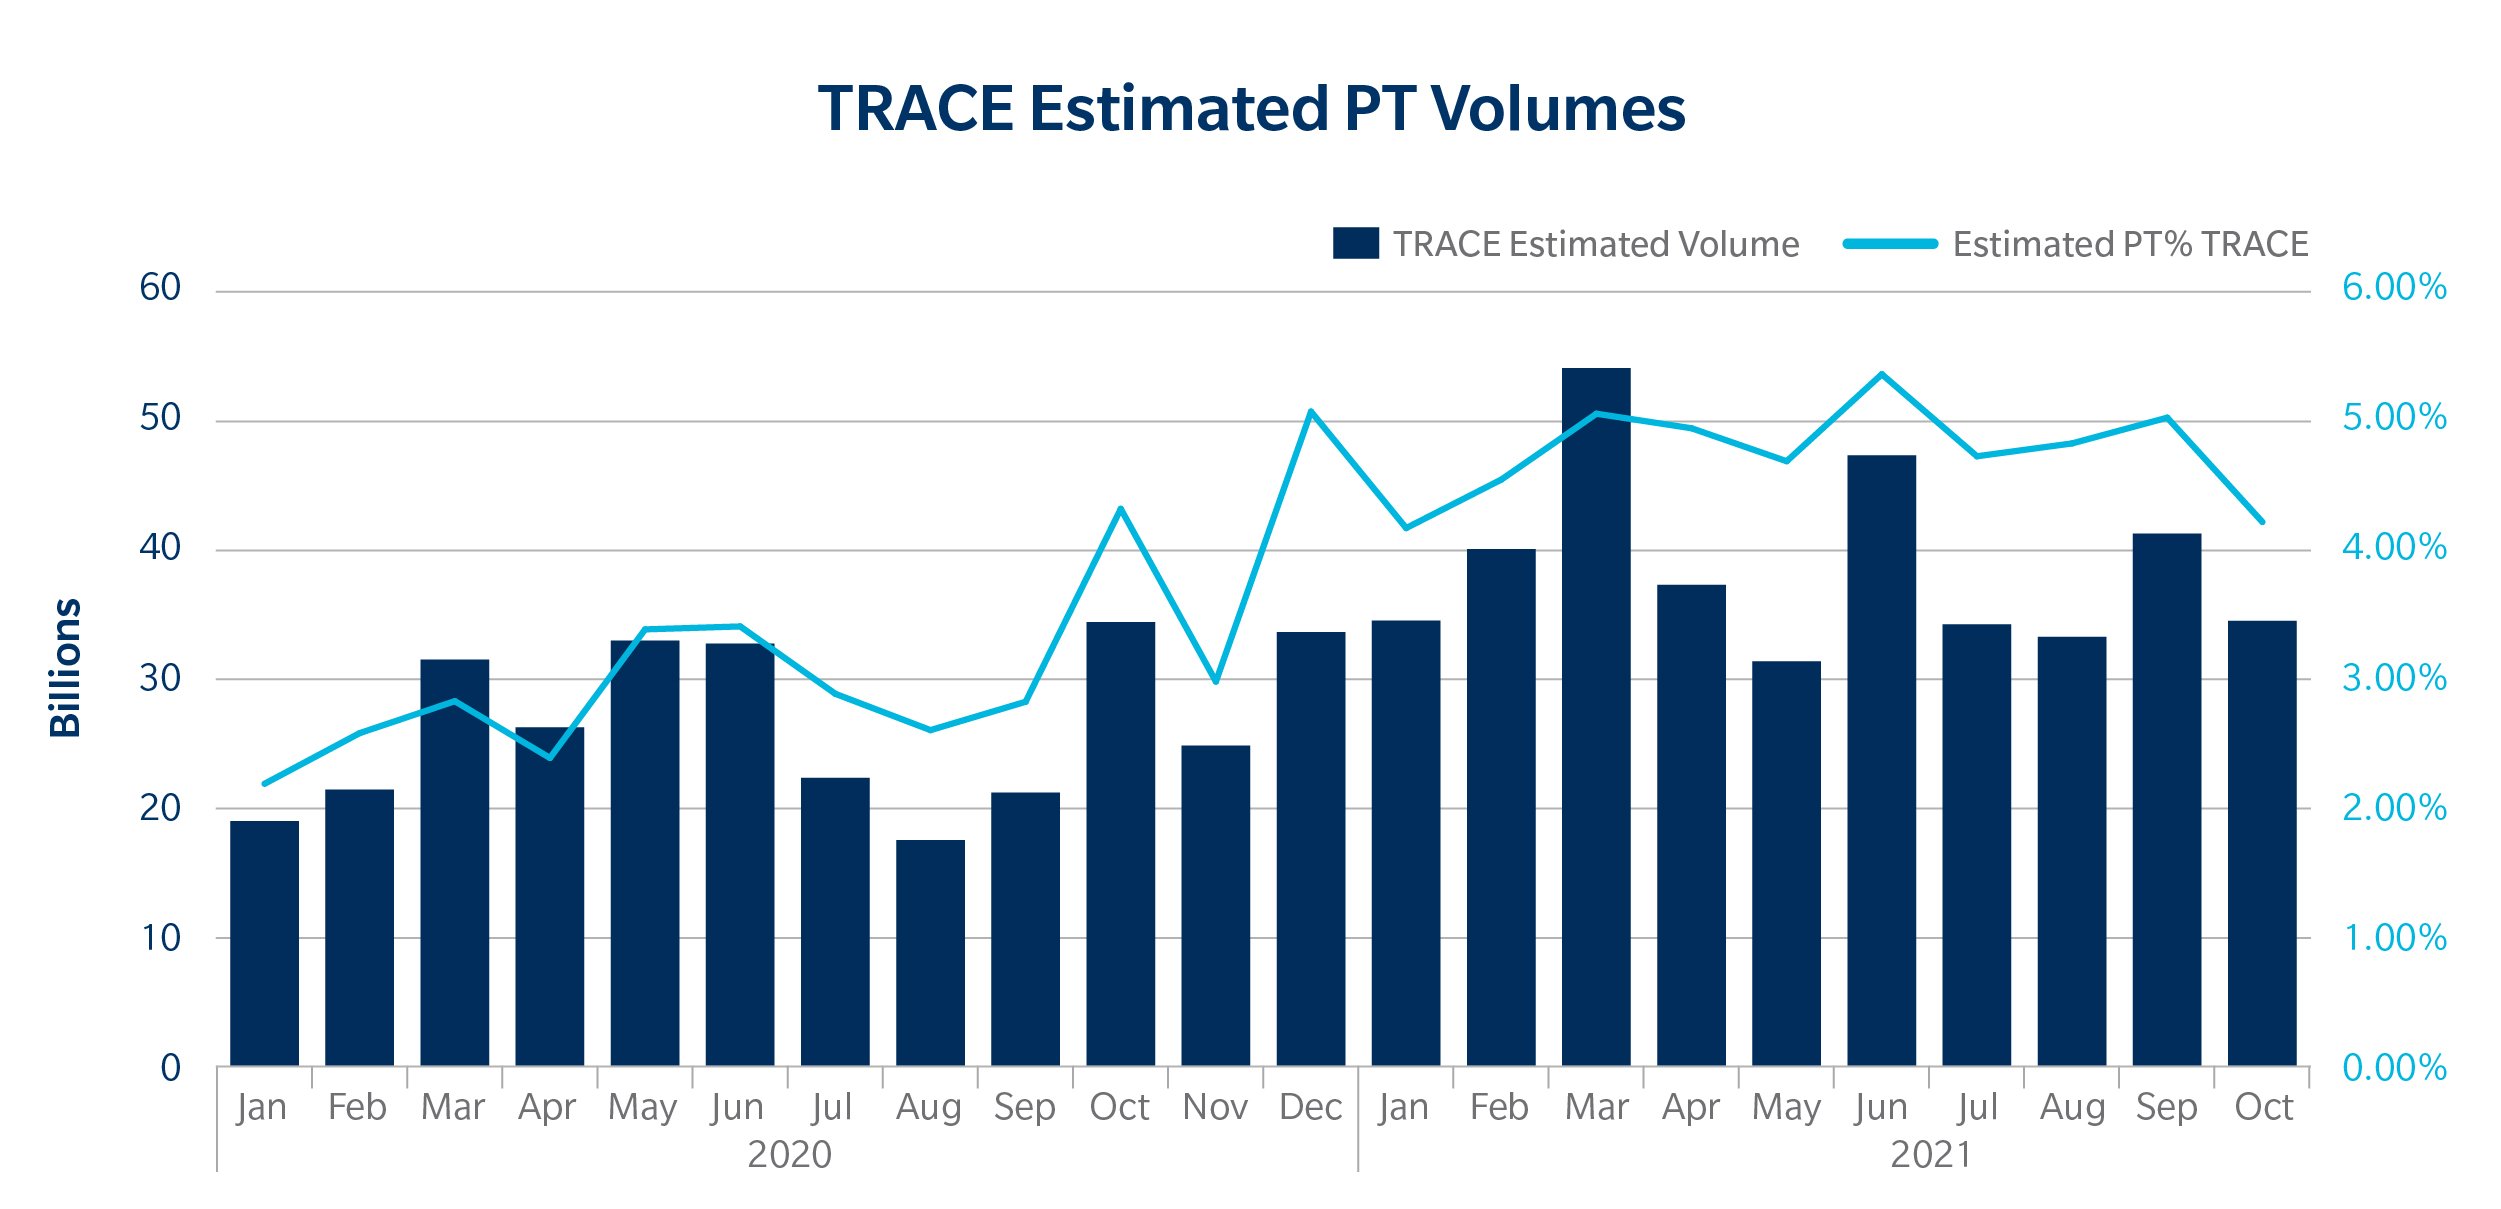
Portfolio trading continues to see strong volumes through 2021. In June, a new milestone was reached - we estimated industry wide totals to be a record 5.4% of TRACE. Quarter by quarter, we estimate PT volumes to be 4.6% of TRACE in Q1, 5.0% in Q2 and 4.9% in Q3, demonstrating the stability of its place in the market and its growth potential.
To an extent, we’d expect as much: comparing October 2020 and October 2021 we more than doubled the number of portfolio trading users trading US credit. Still, that demand proves the extent to which clients across our business continue to test the protocol within their trading strategies and workflows.
Execution Quality for Portfolio Trades
Measuring execution quality for portfolio trading has its challenges: fairly obviously, every trade is executed for different reasons in different market conditions.
That said, because Tradeweb has the advantage of seeing large volumes of portfolio trades across our platform, we can use these as a reasonable proxy for the execution across the market. Looking at data from portfolio trades executed in competition with multiple dealers (in-comp) from March – October 2021, we consider three different metrics in order to capture execution cost as best as possible: performance vs Bid/Offer, performance vs Mid and Hit Rates.
This framework captures not only an estimate of the cost of trading but also how often an inquired trade is completed.
Bid/Offer Spread
To measure performance vs the Bid/Offer, we calculate the percentage of the spread captured when executing at a particular level. For example, if you sell a bond on price at 100.2 and the Bid/Offer is 100/100.5, then the bid offer spread captured (BOS) is equal to 40% as this is the percentage of the spread you are above the bid. If you are buying a bond, we would calculate this metric vs the ask instead. Therefore, whether you are buying or selling, if you trade at the mid, your BOS would be equal to 50% and if you trade better than the mid, your BOS would be above 50%. In our calculations, we use our Ai-Price bid and offer levels for reference.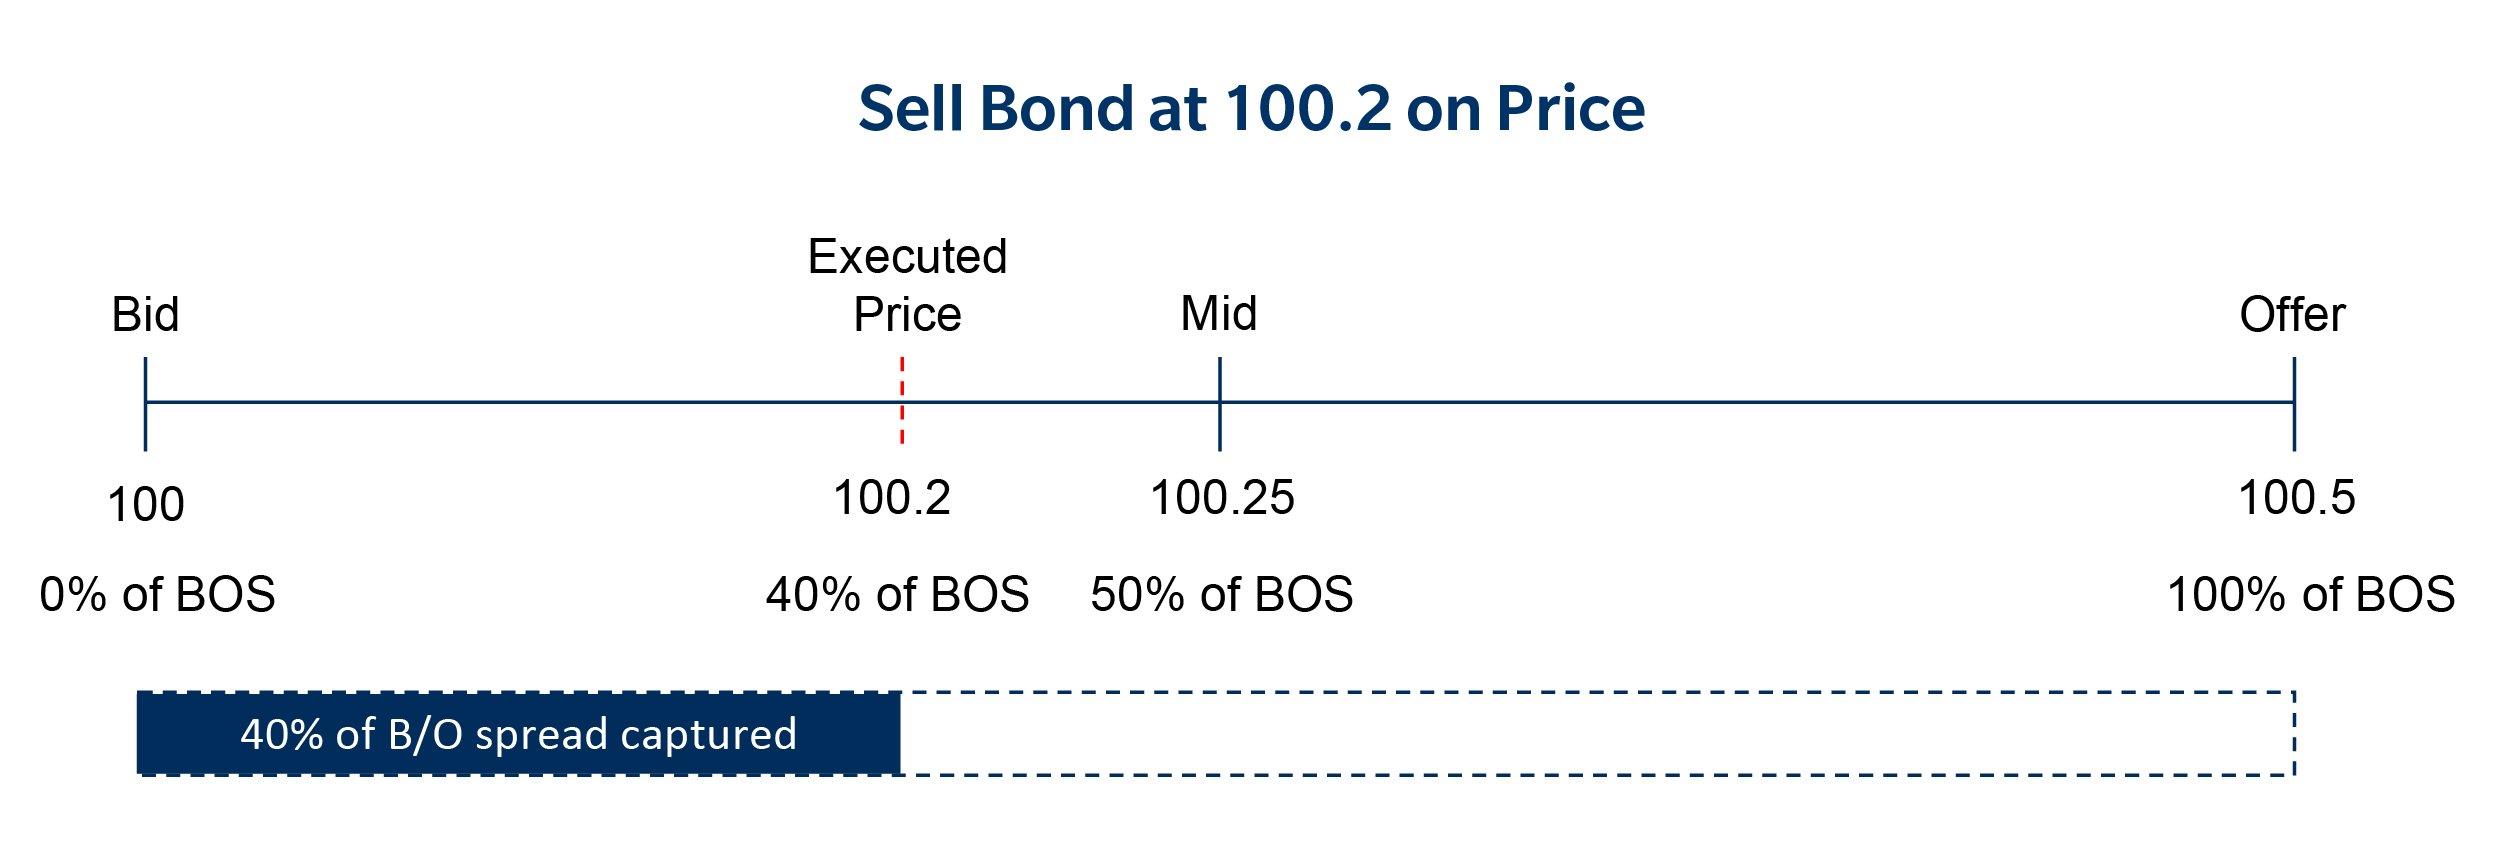
Using Tradeweb in-comp portfolio trades from March-October 2021, the average BOS is 43%. If we look on a volume weighted average basis, where line items with higher notional take more weight in the calculation, the BOS is 35%. This follows the intuition that on average you pay a slight premium for higher notional items, although you still trade closer to the mid than to the bid/offer side.
Performance against Ai-Price Mid
A similar metric to BOS would be to compare the executed level to the Ai-Price midpoint. This comparison against one specific value would allow us to remove any bias caused by very wide bid/offer spreads. We found that 44% of items in portfolio trades executed better than the Ai-Price mid and 73% within 2 bps of the mid or better. If the majority trade very close to the mid-level, outcomes are good for investors.
It is interesting to note that this is execution quality has remained fairly constant over time and has improved. Both the volume weighted average BOS and percentage of items trading better than the mid have shown increases since H2 2020. This shows that the pricing seen in portfolio trading is a feature of the protocol itself, and not caused by the short-term effect of its growth in the market.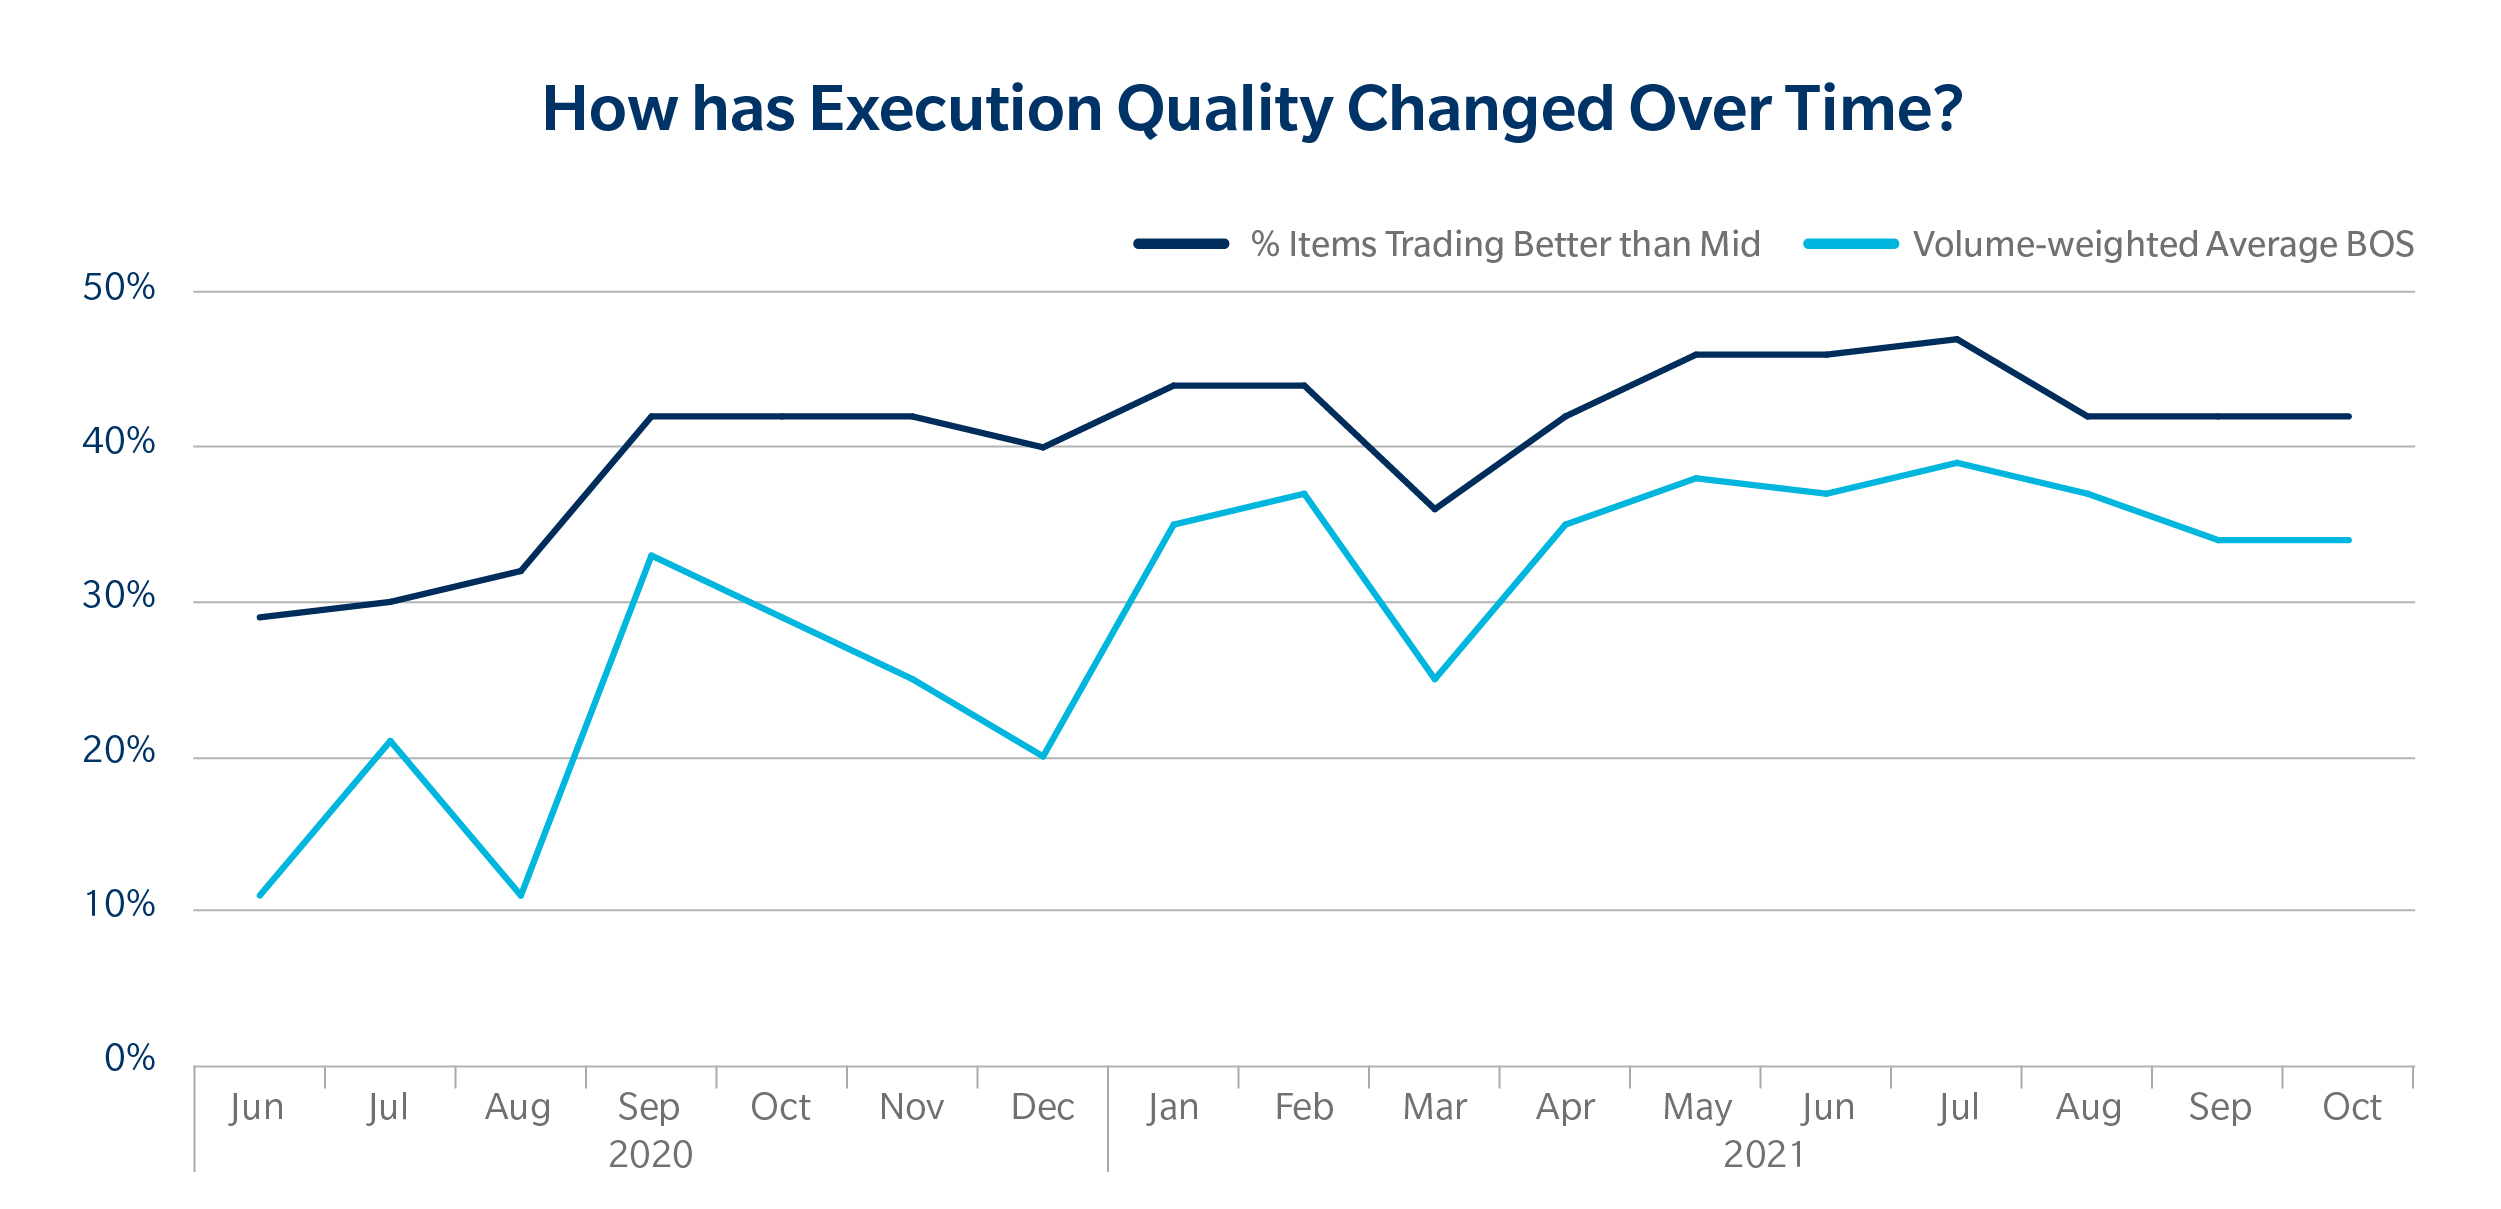
Hit Rates
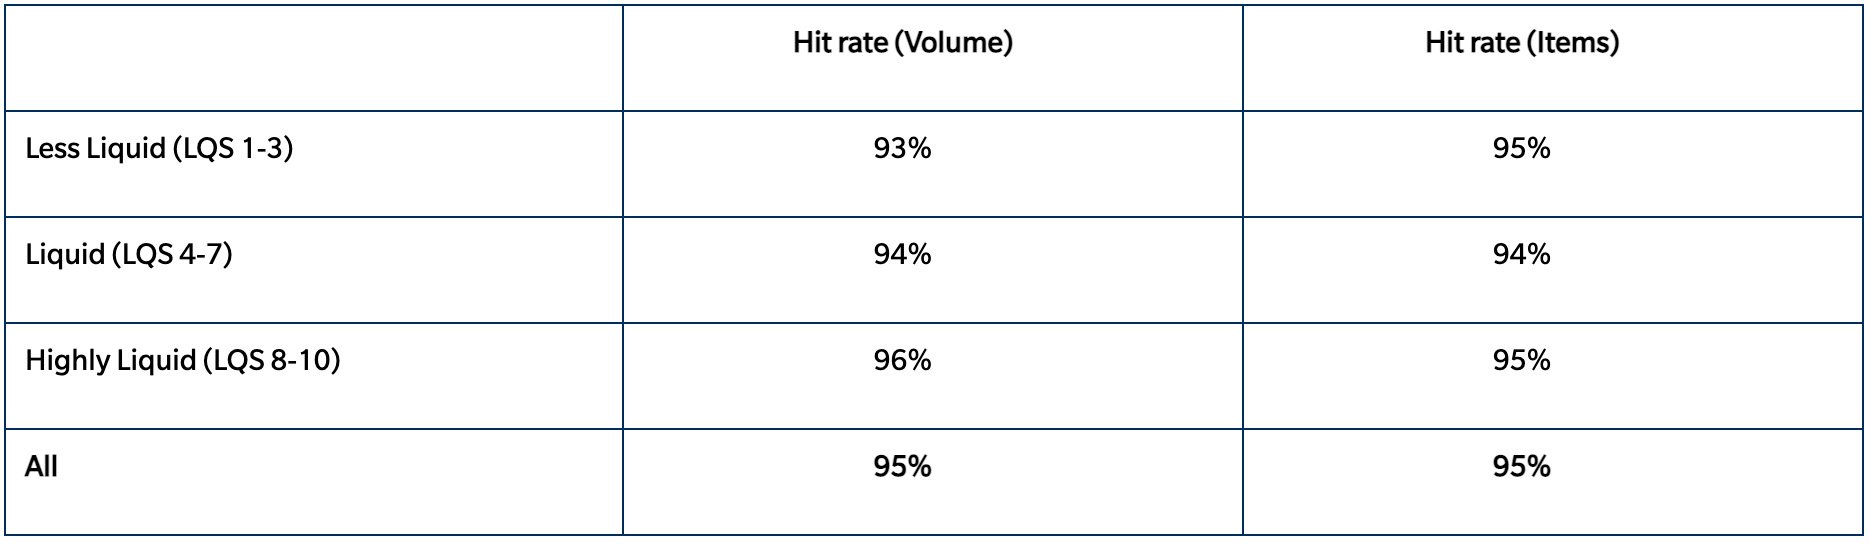
One considerable advantage of portfolio trading is the extremely high hit rates. Clients tend to diligently construct their portfolios with the aim of trading as one piece of risk, and as a result, hit rates have consistently remained high on Tradeweb. If you assess portfolio trades executed in-comp from March to October 2021, the hit rate is 95% in volume terms and also 95% in terms of items traded. Moreover, these hit rates remain high even when our clients transact across thinly-traded securities:
Overall, using these three metrics, portfolio trading performs very well. Not only is execution extremely close to the mid, the hit rates for even the most illiquid items remain high. The protocol allows clients to trade very considerable risk at competitive levels and with certainty in execution.
Portfolio Construction and its Impact on Execution
As noted in our previous blog, the portfolios we see trading on our system tend to be very diverse with items ranging in maturity, notional, direction, market segment, sectors and liquidity scores. That can make it difficult to isolate whether any one of these qualities materially influence execution cost. We could look at extreme cases: comparing the execution quality of portfolios with high diversity in sectors or maturities against those with lower variation. However, doesn’t allow for much consideration of confounding effects: in short, there factors may overlap so it is necessary to find which properties of the portfolios matter most.
To measure the effect of all these factors on the cost of trading (measured by BOS), we constructed a linear model of many portfolio factors. This allowed us to more easily control for other factors to understand the marginal effect of one particular quality of the portfolio versus others.
We found that three factors stood out as significant: portfolio volume, portfolio liquidity and # of sectors included in the portfolio.
As expected, smaller notional traded and higher liquidity is associated with higher average BOS values. It is interesting to note that portfolios which included a higher number of unique sectors were associated with a higher BOS, controlling for # items, notional traded, liquidity score and maturity diversity. This implies that sector diversity is important to portfolio trade construction – the more diverse a portfolio, the higher execution quality you can expect.
This also implies that the marginal effect number of line items and variance in liquidity, maturity and volume were not statistically significant in explaining the variation in BOS. This suggests clients can be more flexible when constructing portfolio trades without adversely impacting execution.
In Review
In analyzing execution quality for these trades, it is becoming clearer why the portfolio trading protocol is become more and more popular. Portfolios tend to execute very close to the mid on average and have extremely high hit rates - even for the most illiquid items. Sector diversity is also an important factor for execution with more diverse portfolios tending to have higher execution quality once controlling for other potential confounders.
Portfolio trading is just one part of a larger shift in fixed income electronic trading and it is clear that this widespread electronification is still only in its early stages. With lots of room to grow, and our continued innovation of this protocol, we expect portfolio trading to maintain this upward trajectory into the new year and beyond. Stay tuned for our next blog where we will consider portfolio trading with a longer lens, and how the protocol has changed and morphed in response to an evolving market.
To learn more about the benefits of portolfio trading at Tradeweb, click here.
Related Content
The Introduction and Initial Impact of PT
Deciphering the Size of the Portfolio Trading Market