A Review of 2014 U.S. Swap Volumes
By Amir Khwaja, Clarus
Originally published on Clarus
In this article I will review 2014 Swap volumes and do so in a similar format to my July article; A Six Month Review of Swap Volumes. As usual our universe is not global but specific to the United States. It consists of trades reported to US Swap Data Repositories, either executed On a Swap Execution Facility or Off Facility.
2014 was a very significant year for the Swap market.
Significant as for the first time for this OTC market it became mandatory to execute Swaps on a regulated venue. From February 2014, most Vanilla IRS (spot, par) were required to be executed On a SEF.
There was much concern on what this would mean for volumes: would trading move off-shore or from Swaps to Futures.
Lets see what the data shows.
USD IRS ON SEF
Starting by using SDRView Res to show gross notional in On SEF USD IRS by month.
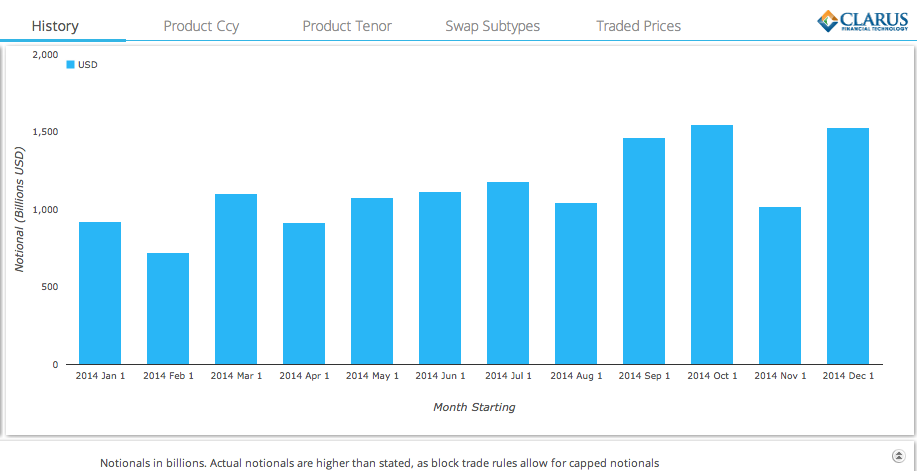
Which shows:
- After the low point of mandatory execution in Feb, a steady pick-up in volumes
- Around $1 trillion a month traded each month in the first half of the year
- A significant pick-up (> 40%) in volumes from September
- September, October and December showing record On SEF Volumes
- With > $1.5 trillion traded in each of these months
- (For details see the earlier articles for Dec, Nov , Oct and Sep).
We know the increased volume from September onwards was driven by increased Interest Rate Volatility and the need for market participants to hedge or re-position their portfolios.
So nothing in the data here to suggest trading moved off-shore or to Futures.
EUR, JPY & GBP ON SEF
And what of the three other G4 major currencies?
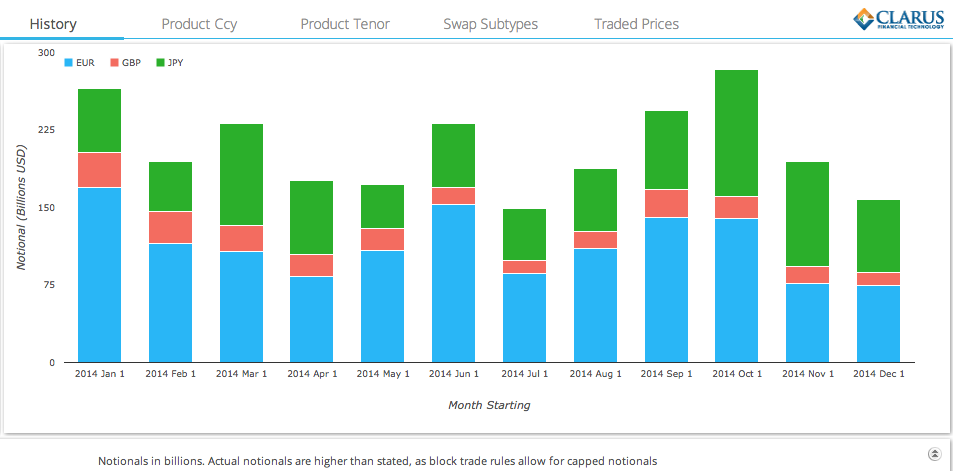
Again a similar pattern to USD with record months in September and October, just December showing low volumes.
Overall the aggregate volume in these three currencies remains below 20% of the USD volume, reflecting the fact that majority of trading in these currencies is taking place in London, Europe and Tokyo. Trade reporting and public dissemination outside the US is lagging (see my articles on the status in Europe and Japan) and so is not currently useful for our purposes.
For Cleared Swaps we have recently started collecting volumes direct from all Clearing Houses, see Tod’s article on Transparency in Clearing Data. As we build up sufficient history in our CCPView product, we will use this as another data source to shed light on global volume trends. (Make sure you subscribe to our newsletter to be kept informed).
USD IRS OFF SEF
Lets now take a quick look at Off SEF Volumes.
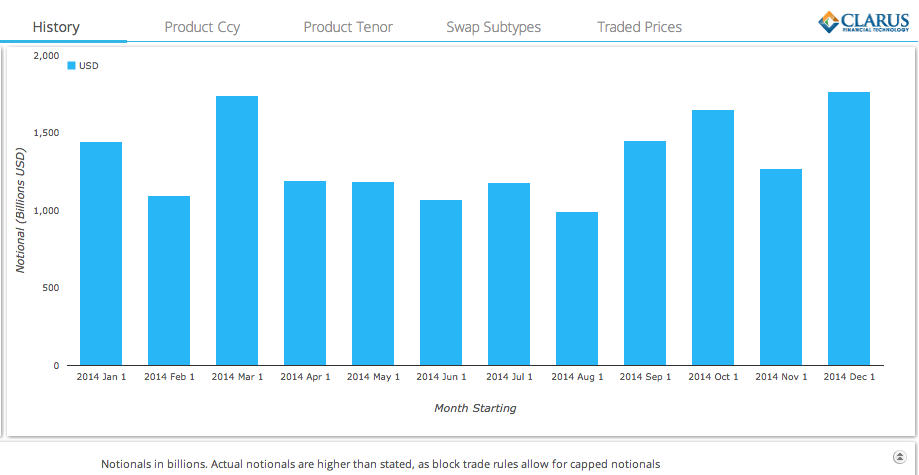
Which shows a very similar profile to On SEF.
Surprising as given the expiry of package exemptions for mandatory clearing, we would have expected a drop in volumes relative to On SEF over the course of the year. One reason for not seeing this drop is the spikes in reported trades on specific days (see November) which are clearly not the result of actual trading activity. If we were to exclude these, we would see On SEF volume between 50-60% of total volume, as we would expect given the large volume of Forward Start Swaps that are traded.
SWAP PRICES
Lets move on to looking at Swap prices over the year. Using SDRFix we can see the change in the major tenors.
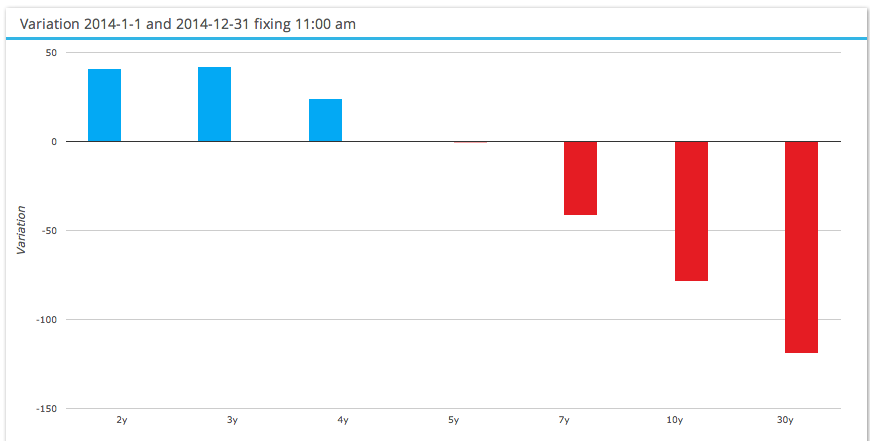
Which shows that between 1-Jan and 31-Dec:
- 2Y and 3Y Swap Rates increased 40 bps
- 5Y Swap Rate did not change
- 10Y Swap Rate dropped 78 bps
- 30Y Swap Rate dropped 119 bps
- (A good time for US based folks to re-mortgage?)
So a flattening of the yield curve with 5Y as the pivot point. Very different from a rise in the whole term structure that many of us would have have expected back in Jan 2014.
And lets look at the daily price history of the 5Y and 30Y tenors.
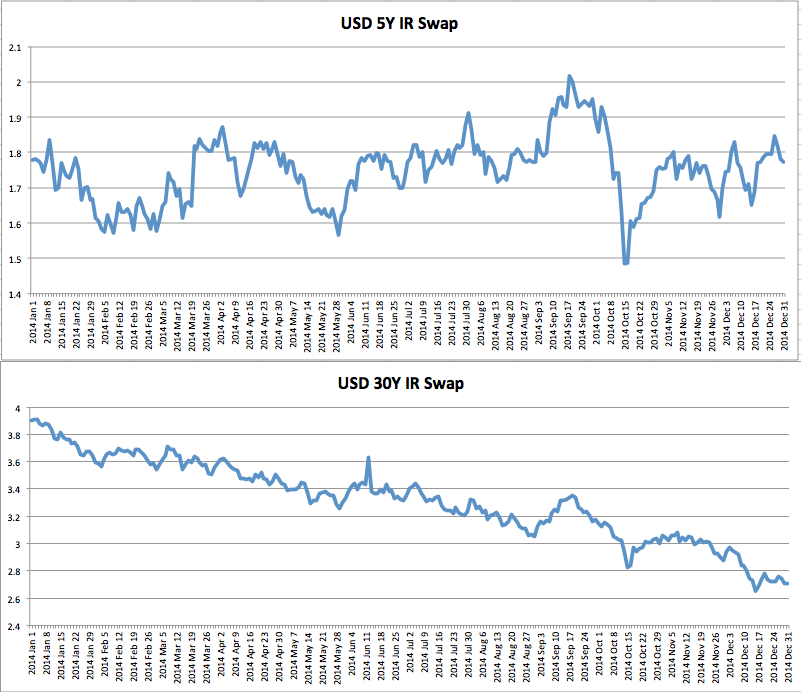
Which shows:
- 5Y Rates generally in the 1.6 to 1.8 range
- 5Y Rates with large moves out of this range in Sep and Oct
- 5Y High to Low of 50 bps
- 30Y Rates on a steady decline over the year
- 30Y Rates down from 3.9 to 2.7
So certainly in 2014 and particularly the last 4 months, we have seen increased interest rate volatility. A trend we would expect to continue as we get closer to the point that the Federal Reserve starts to raise Interest rates.
SEF MARKET SHARE
Lets now use SEFView to see which SEFs have gained and lost share in 2014.

Which shows:
- Increased volumes in Sep, Oct and Dec
- $2 trillion in 5Y Swap Equivalent transacted in Dec alone
- A case of “A Rising Tide Lifts All Boats?”
- Just that BBG and DW/TW rising much more than others
- We know for TW part of the reason is the success of their compression list trading
- Which in some months is up to 30% of TW volumes
- BBG has more recently offered compression lis trading, so it is not a big component of their volumes
And focusing on market share:
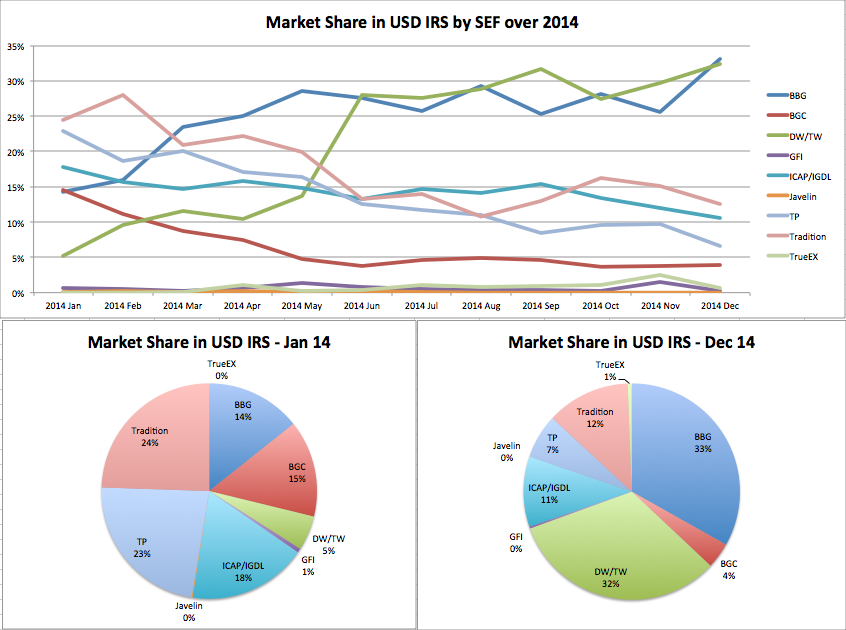
Which shows that in 2014:
- The winners are clearly BBG and DW/TW.
- BBG has increased its share from 14% in Jan to 33% in Dec
- DW/TW has increased from 5% to 32%
- (Both have added compression/list trading over the year)
- IDBs have seen significant falls in share
- Tradition from 24% to 12%
- TP from 23% to 7%
- ICAP/IGDL from 18% to 11%
- The rest don’t show any real change
- Except for TrueEx, which shows a gain from its successful package trade offering
So we can say that the Top 5 Venues (BBG, DW/TW, Tradition, ICAP, TP) have 95% of the market. Or that the Top 4 have 88% and the Top 3 have 77% market share. Is there room for 3, 4, 5 or more venues in USD IRS?
One would not have thought so.
At least not without significant differentiation between the venues.
For instance we know that the IDB platforms have major shares in Basis Swaps, OIS Swaps, FRAs and Swaptions, each of which could justify a smaller share of vanilla IRS. We also know that services like TrueEx package terminations and allocations and TW and BBG compression list trading provide differentiation. So new innovations may allow firms to remain competitive.
However we would still expect to see some SEF consolidation in 2015. Either exists from the market or mergers.
SUMMARY
2014 was a a significant year for US Swaps trading as On SEF became mandatory.
There was a concern that this would result in a drop in market volumes.
The data shows that this did not happen.
Sep, Oct and Dec were record months for On SEF volumes in USD IRS.
Interest Rate Volatility was much higher in September driving these volumes.
The Swap Curve flattened over the year, pivoting on the 5Y, with short rates up 40bps and long down 118 bps.
Higher volumes benefited most of the SEFs.
Bloomberg and Tradeweb both gained significant share over the IDBs.
Each has just over 30% of the volume in Dec 2014.
The Top 4 venues had 88% market share in Dec 2014.