Credit Markets Put to the Test in Tariff Tumult

Data analysis by: Harveer Mahajan, Vice President, U.S. Credit, Carol Luk, Director, U.S. Credit and Gioacchino Accurso, Director, European Credit
It’s one thing when the stock market has a bad day. It’s quite another when global stocks, U.S. Treasuries, European government bonds, corporate credit, municipal securities and derivatives markets all take a dive at the same exact time.
That’s exactly what happened following the now infamous April 2, 2025 “Liberation Day,” when U.S. President Donald Trump introduced a sweeping set of tariffs on countries around the world, setting the stage for a global trade war. Over the subsequent days following the announcement, the S&P index fell over 10.5% in just two days and the CBOE Volatility Index (VIX) spiked to over 45, suggesting an increase in investor uncertainty and market volatility, as financial markets around the world were sent into spiral. In a matter of days, both the U.S. Treasury market and the U.S. corporate bond market became the focal point of every market discussion.
On April 8th, overall trading volumes in U.S. corporate credit rose to 2025 highs as the effects of these tariffs rippled through U.S. credit markets. U.S. investment grade (IG) credit spreads widened by an average of roughly 15 basis points (bps), as measured by Tradeweb’s Automated Intelligent Pricing tool (Ai-Price).
This piece explores how these macro themes affected U.S. corporate bonds in early April and how these effects have persisted throughout the month.
Measuring Portfolio Trading and HY Market Liquidity
One massive theme that has been prevalent in credit markets over the past few years has been the growth of portfolio trading (PT), whereby asset managers are able to trade a basket of bonds as a single package deal. We have previously spoken about the benefits of this method of trading, including its high hit rates and its ability to tap into new sources of liquidity for bonds that are not frequently traded. However, during some previous periods of market volatility, portfolio trading has tended to taper off, such as throughout the market volatility we experienced in the 2022 credit crunch or during the market sell-off in August 2024.
That was not the case in April 2025. Portfolio trading volumes maintained a double-digit share of the overall market through April, reporting 11.3% of total TRACE volumes through the end of the month.
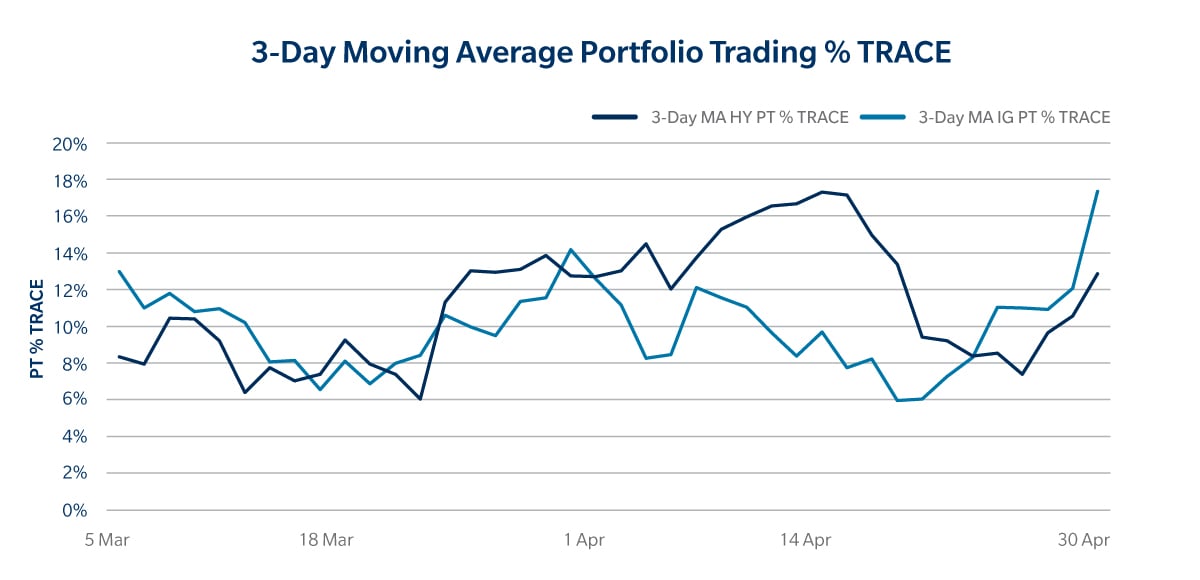
This push toward continued usage of portfolio trading in April 2025 was especially pronounced in high yield, where we saw a spike in portfolio trading hitting a record 20% of TRACE on April 10 and April 15 – more than double the March monthly levels, as shown in the chart above which is based on a 3-day moving average.
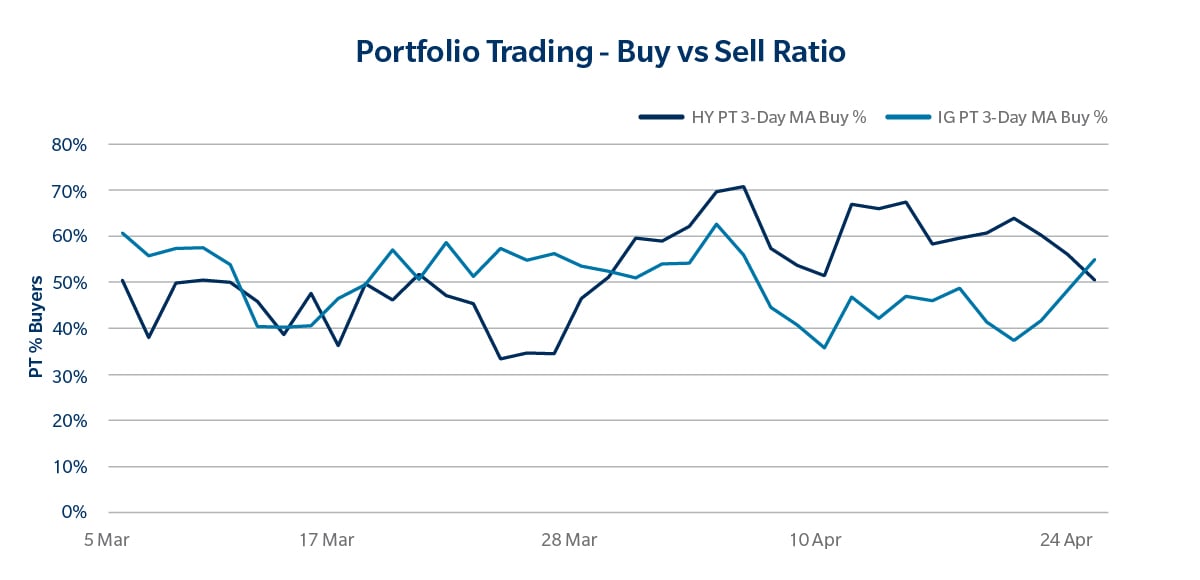
One phenomenon we observed was that clients tended to buy high yield risk in portfolios through this period, as shown in the charts below. These portfolios tended to line up with the HYG ETF, with 77% overlap on average, which was 10 percentage points higher than March. It is interesting to note that this shift toward buying high yield portfolios contrasted with net sellers in investment grade debt, as shown in the chart below. It’s clear that clients found portfolio trading to be an effective way to execute these directional bets, despite volatile market conditions. This suggests continued growing client confidence in the tool as compared to previous bouts of market stress.
High yield liquidity across the market seems to have improved this year for larger sizes. In April, the average size of a high yield PT on Tradeweb was 43% higher than the 2024 average. This is a trend we have seen play out across our protocols, with the average size of high yield request-for-quote (RFQ) inquiries also increasing this year on the platform and clip sizes rising 15% in the first quarter of 2025 as compared to 2024 averages. Perhaps this trend marks a turning point in high yield, where clients are more comfortable trading larger risk electronically on a trading platform as opposed to over the phone in a traditionally opaque market.
Execution Quality & Liquidity Pools
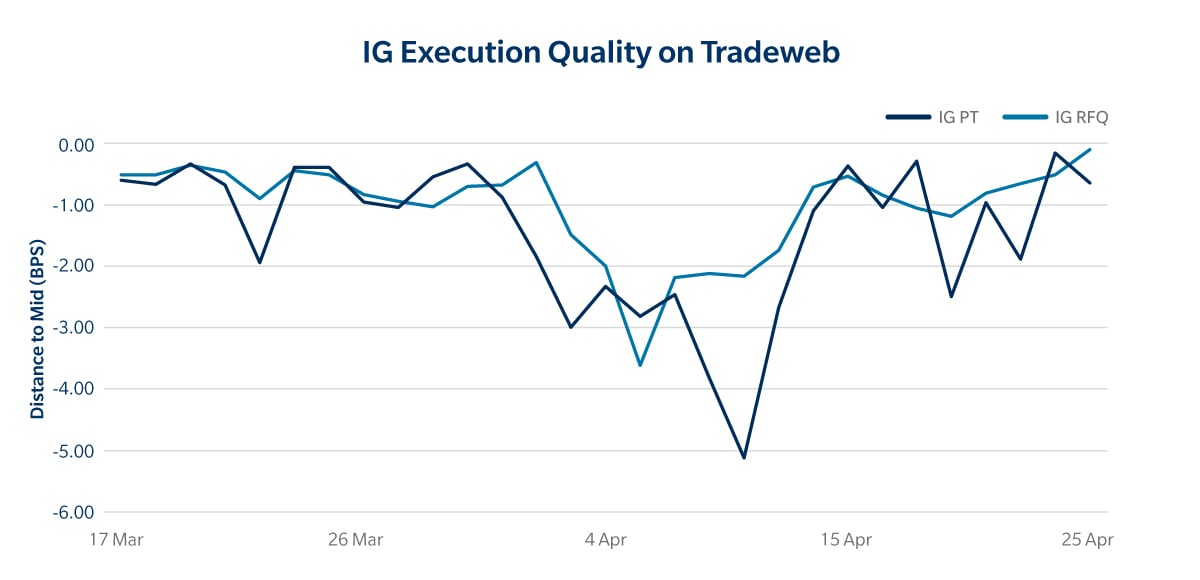
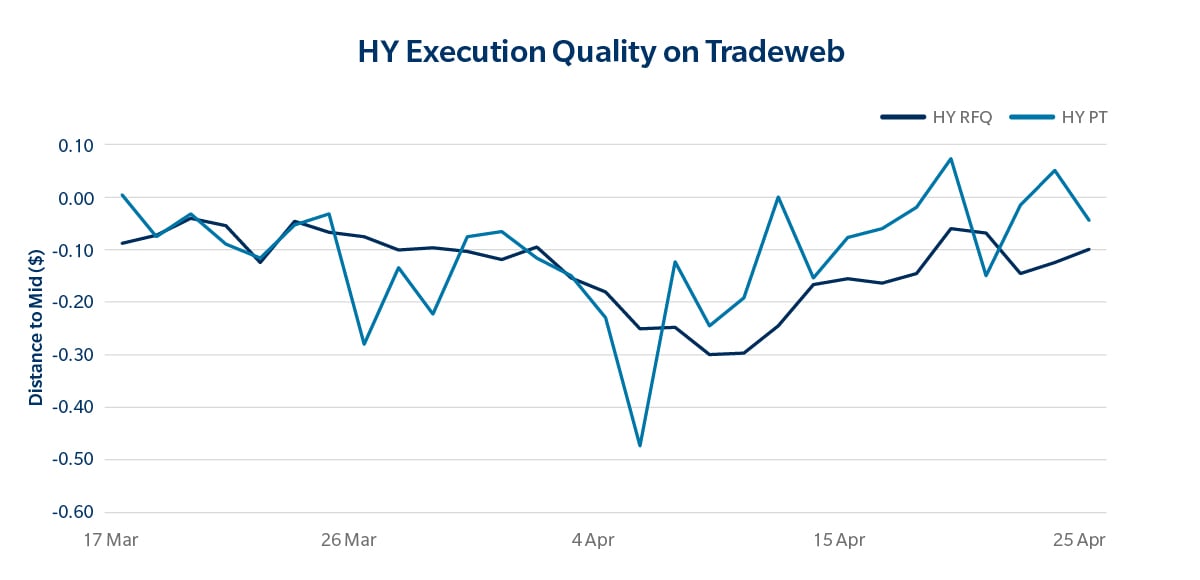
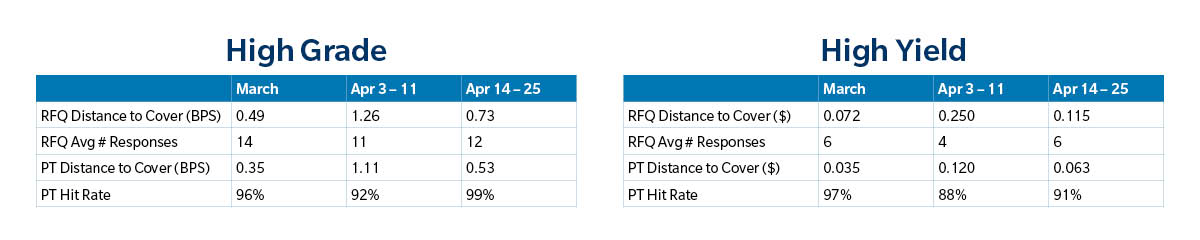
As expected during times of stress, bid/offer spreads widened dramatically in corporate bonds as pricing became less transparent across trading protocols. After the period of volatility subsided, transaction costs quickly returned to previous averages. We observed similar phenomena when assessing the broader liquidity pool. As shown in the tables below, on Tradeweb, we saw fewer responses to RFQs and lower portfolio trading hit rates in early April during this period of volatility, which then quickly returned toward normal levels over the following days as volatility subsided.
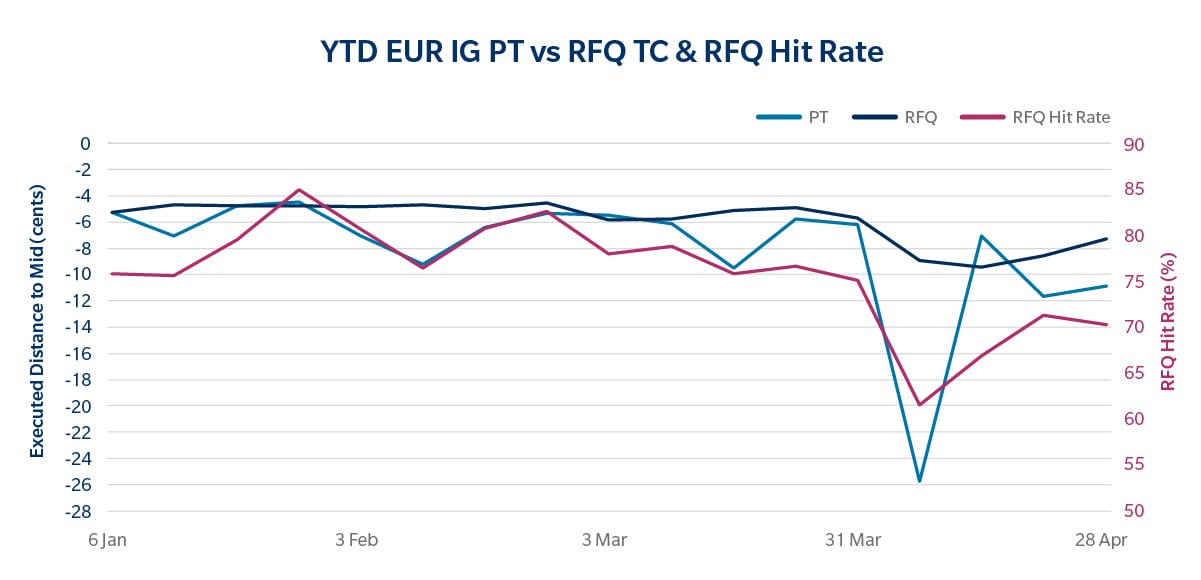
These trends were also seen in European IG credit markets, with realized bid/offer across both RFQ and PT widening during the heightened volatility. While RFQ hit rates dipped, they remained elevated, as electronic trading held up well during the period. PT continued to offer certainty of execution to clients who had immediacy needs. Many clients used both PT and RFQ during the period, as part of a broader execution toolkit, depending on their pricing or immediacy needs while trading.
Trading Innovation Helps Improve Liquidity
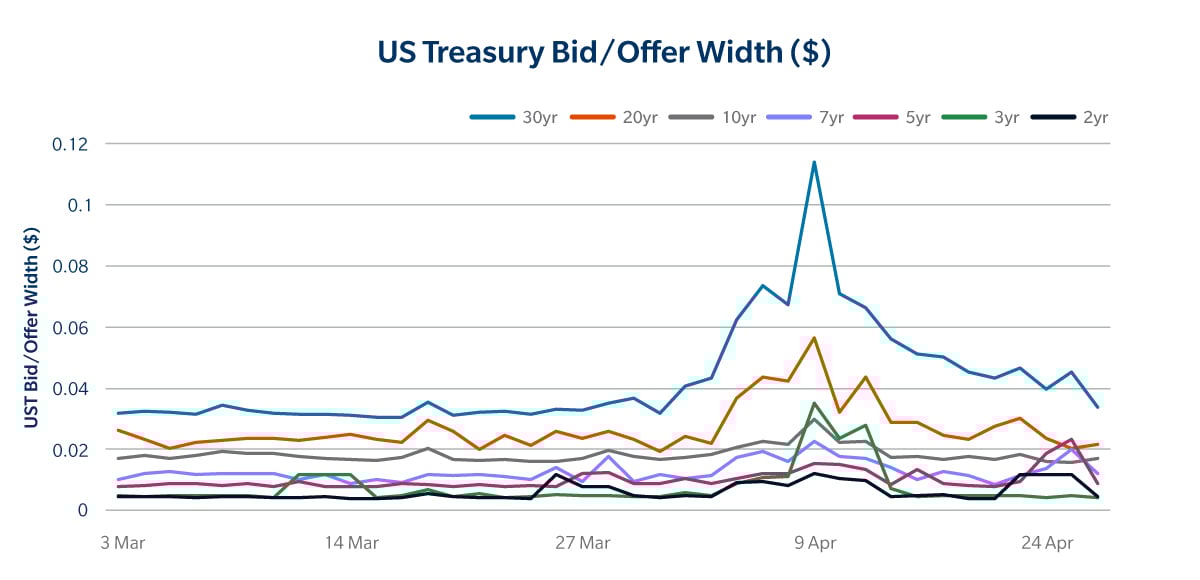
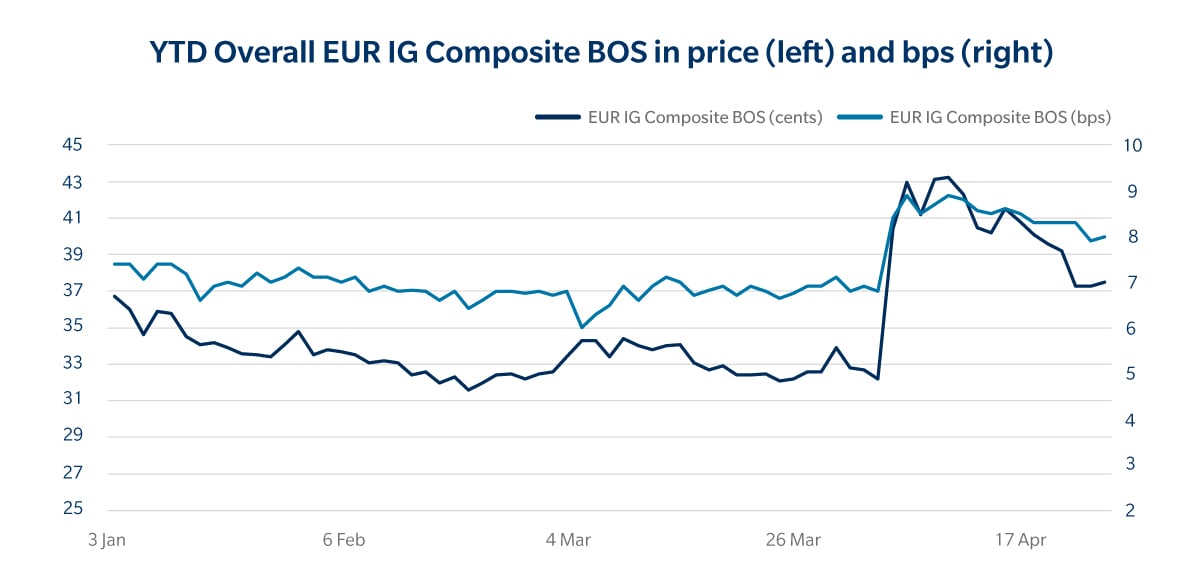
Tradeweb’s innovations in credit over the last few years make navigating these types of markets much easier. Tradeweb’s Net Spotting solutions, which aggregate trade positions and calculate net interest rate exposure to each Treasury benchmark from the accompany Treasury hedges across counterparties, help clients get the best spot possible on their corporate bond trades, even as Treasury bid/offers widened significantly. This solution has led to savings of approximately $355 per million (mm) for IG trades benched off the 30-year Treasury when spotted at mid at 4pm on our platform from April 3-11 – a 119% increase compared to March averages. That said, this increase was significantly less dramatic than March 2020, when we saw an increase of 2800%. We saw European IG Credit bid/ask in price and spread terms also widen from circa ~33 cents to 43 cents, in price terms, and ~7bps to ~8.8bps in spread terms (as measured by our Composite).
This complements our robust Tradeweb AllTrade® network, which also saw increased usage in early April. Between April 7-11, we saw an anonymous responder win 60% more RFQ volume in investment grade and 126% more volume in high yield as compared to their March weekly averages. These anonymous responses ultimately meant better execution for the client, translating to $2,751 per mm in investment grade and $8,046 per mm in high yield, when comparing the anonymous winning level to the next best disclosed response. This demonstrates the value of the Tradeweb AllTrade® network, especially during times of market volatility where traditional pools of liquidities may temporarily dry up.
Portfolio Trading Gains Momentum Amid Market Volatility
Despite the market turbulence in early April, portfolio trading didn’t lose steam—in fact, it picked up. Clients leaned into it even more, reaffirming its value as a reliable trading protocol in any market environment. This growing adoption among clients highlights a clear client priority, which is certainty of execution and efficiency when trading large baskets of risk. Because dealers price risk at the portfolio level, the precision of each individual line item is less critical. In volatile conditions, where pricing single securities becomes more difficult, portfolio trading stands out as an attractive solution. This is especially prevalent in the high yield space, where pricing is less transparent compared to investment grade markets, making the ability to trade entire baskets of risk even more compelling.
While many believe this period of tariff-driven volatility seems to be behind us, with the liquidity pool measures and TCA metrics returning closer to their March averages in short order, there is still a healthy level of uncertainty that remains around what’s next for markets. Our market-leading portfolio trading solution, combined with our Net Spotting and Tradeweb AllTrade® network, make Tradeweb a best-in-class source of liquidity, across market conditions.
Related Content
Bond Market Turbulence: How Tariffs Are Stress-Testing Liquidity
Automated ETF Trading Shows Resilience During Tariff Turmoil