Market Snapshot: Japanese Bond Yields Hit Record Lows
Japanese government bond yields hit record lows today, while U.S. and U.K. benchmark bonds hit fresh 12-month lows, according to data from Tradeweb.
In, Japan, the 10-year bond went below zero for the first time ever. Closing today at -0.021%, the Japanese benchmark was down 6.3 bps from yesterday’s close of 0.042%. The intraday low was -0.024%, and the intraday high was 0.027%. This new low comes less than two weeks after the Bank of Japan’s decision to introduce a charge on new reserves and negative interest rates and as the Nikkei dropped more than 5%.
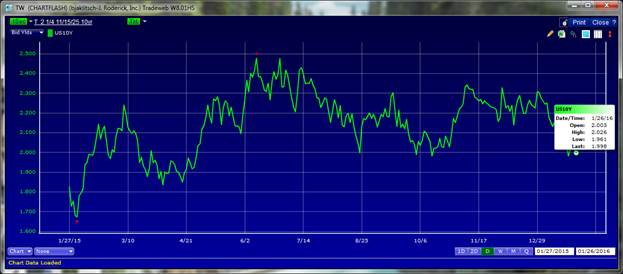
In the U.S., the bid yield for the 10-year Treasury note was 1.716% as of 2:25 PM ET, down 1.9 bps from yesterday’s close of 1.735%. The intraday low was 1.684%, and the intraday high was 1.767%. This was the lowest point in intraday trading since February 2015.
In the U.K., the bid yield for the 10-year Gilt was 1.407%. While that was unchanged from yesterday’s close, this security hit an intraday high of 1.458% and an intraday low of 1.389%. As with the U.S. 10-year, this was its lowest intraday point since February 2015.
These moves come amid ongoing uncertainty over the global economy, particularly in China, and the near-term direction of monetary policy from the Federal Reserve and the Bank of England.
Meanwhile, in Germany, the bid yield on the 10-year Bund was 0.234%, up 1.3 bps from yesterday’s close of 0.221%. The intraday high was 0.271%, and the intraday low was 0.196%. This comes amid news that German industrial production fell 1.2% from November to December.
Additionally, below are bid yields for securities that hit new lows:
5-year Japanese bond: -0.255, down 8 bps from yesterday’s close of -0.175%
2-year Japanese bond: -0.242%, down 5.4 bps from yesterday’s close of -0.188%
5-year German bond: -0.353%, down 0.3 from yesterday’s close of -0.350%
2-year German bond: -0.513%, down 0.9 bps from yesterday’s close of -0.504%
The charts below are based on indicative, real-time data from Tradeweb.
CHART 1: Japanese 10-Year Yields – February 10, 2015 – February 9, 2016 (12 Month View)
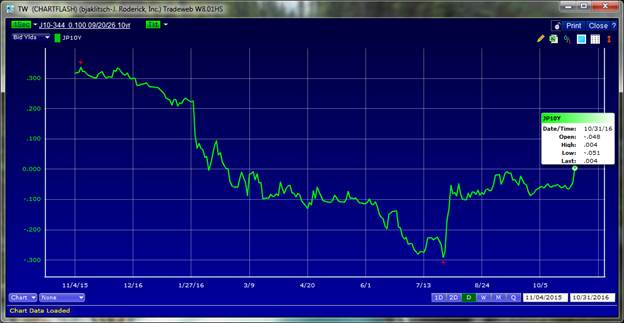
CHART 2: U.S. 10-Year Treasury Yields – February 10, 2015 – February 9, 2016 (12 Month View)