Market Snapshot: European Bond Yields Down Following ECB Decision; U.S., U.K. Yields Up
European government bond yields dropped today following ECB President Mario Draghi’s decision to leave key interest rates at 0.05%, according to data from Tradeweb.
Below are the bid yields on core and peripheral 10-year European government securities:
10-year German Bund: 0.383%, down 3.4 bps from yesterday’s close of 0.417%
10-year French bond: 0.776%, down 5.4 bps from yesterday’s close of 0.830%
10-year Italian bond: 1.559%, down 9.8 bps from yesterday’s close of 1.657%
10-year Spanish bond: 1.720%, down 7.3 bps from yesterday’s close of 1.793%
10-year Portuguese bond: 2.887%, down 5 bps from yesterday’s close of 2.937%
The benchmark 10-year Bund had an intraday low of 0.364%, and an intraday high of 0.449%.
Draghi acknowledged recent market volatility and declining oil prices affecting the Eurozone’s low inflation outlook yet said there was no need for an immediate reaction. He believes current monetary stimulus is working but that “there should be no doubt” further action will be taken to meet the 2% inflation target, if necessary.
In the U.K., the bid yield on the 10-year Gilt was 1.676%, up 5.5 bps from yesterday’s close of 1.621%. Today’s intraday high was 1.679%, while the intraday low was 1.620%. This follows a speech on Tuesday by Bank of England Governor Mark Carney where he stated the economy was too weak to raise interest rates.
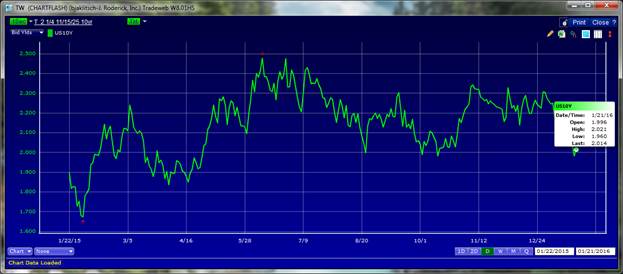
In the U.S., the bid yield on the 10-year Treasury note was 2.014% as of 12:21 PM ET, up 3.2 bps from yesterday’s close of 1.982%. Today’s intraday high was 2.021%, while the intraday low was 1.960%. This follows data showing initial jobless claims rising by 10,000 to a seasonally adjusted 293,000 and debate about the number of potential interest rate increases in 2016.
The charts below are based on indicative, real-time data from Tradeweb.
CHART 1: German 10-Year Bund Yields – January 22, 2015 – January 21, 2016 (12 Month View)
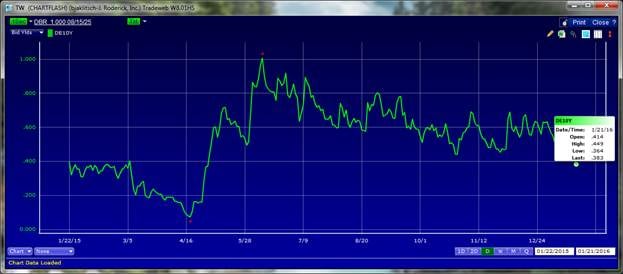
CHART 2: U.K. 10-Gilt Yields – January 22, 2015 – January 21, 2016 (12 Month View)
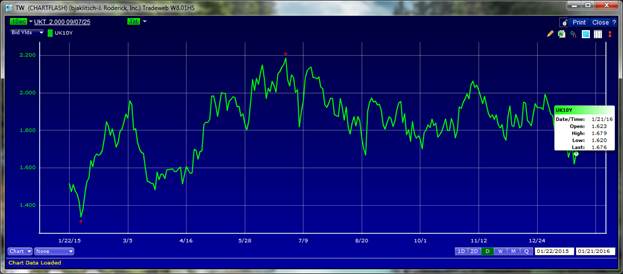
CHART 3: U.S. 10-Year Treasury Yields – January 22, 2015 – January 21, 2016 (12 Month View)